
Thursday, July 2, 2026 — Early Sellers Absorbed, Steady Grind to a Fresh Poor High
Market Overview
NIFTY opened the session in the CPR pivot zone, roughly 24,080–24,090, sitting right at the boundary between Wednesday's balance and open air above it. There was no gap to trade off — the kind of open that tells you nothing on its own and forces you to actually watch the first half hour rather than react to it.
What followed was not a trend day in the explosive sense. There was no single candle that defined the session, no violent breakout bar that dragged the index higher in one motion. Instead, the index built higher in a series of small, orderly steps, each one confirmed by order flow before the next began. By the close, price had cleared Wednesday's entire value area, pushed through every Standard Pivot level from R1 through R4, and printed a fresh high in the 24,270–24,300 zone that the Market Profile structure flags as unresolved.
The session's real story isn't the shape of the candles — it's what happened underneath them. Two separate sell attempts tried to establish control early and at midday, and both were absorbed by resting size sitting at defended levels. Once the second attempt failed, there was no further contest for the rest of the day.
Close context: session high sits in the fresh Poor High zone near 24,270–24,300, well above both the day's Value Area High (24,231) and Point of Control (~24,200). The index is closing at or near its best levels of the day, not fading into the bell.
Order Flow Analysis
Morning session — the first sell attempt and its failure
The 15-minute delta sequence opened constructively: 114, 144, 1.14K, 166 — four bars of mild-to-moderate positive delta as the index held the CPR pivot zone without much conviction either way. This is the kind of print that looks unremarkable in isolation but matters in hindsight, because it meant sellers never got early control of the tape.
The first real contest arrived on the bar flagged -984, printing right into the prior session's Poor High at 24,142.6. This is a textbook place for a sell attempt: an unresolved level from the previous day, sitting just above the developing pivot zone, is exactly where aggressive short-side participants would want to test whether yesterday's unfinished business gets resolved to the downside. The delta print confirms real aggression showed up — this wasn't a quiet drift, it was a deliberate push.
It failed. The footprint at that price cluster shows resting size stacked well beyond what a single 15-minute bar would normally absorb — a 620-lot print and, a few bars later in the same price band, a 1.7K-lot print, both sitting almost directly on top of the 24,142.6 level. Absorption is the right word here, not just "buying showed up": the aggressive selling hit that size, failed to move price through it, and got absorbed into it rather than pushing through. The very next bar confirms this — delta at -108, a much weaker follow-through than the initial push, telling you the sellers' second wave had already lost conviction.
Two bars after the failed attempt, delta flipped to +1.92K — a single bar strong enough on its own to erase the entire morning's selling pressure and then some. This is the actual pivot point of the session. Sellers had just spent their best shot at a well-defined level and immediately lost it to a buyer response an order of magnitude larger than the attack itself.
Midday — quiet grind, second failed sell attempt
From there through the late morning and into midday, the tape went quiet in the way that trend days often do once the initial contest is resolved: -4, 48, -13, -184, -79, 206, 418, 130. Individually these are unremarkable prints — small positive and negative deltas trading back and forth — but the net effect across this stretch was still mildly positive, and more importantly, price didn't give back any of the ground gained off the +1.92K reversal. That's the tell of a market that has already made its decision and is now just confirming it.
The second point of real interest is a bar flagged -54 — a small headline delta number, but tagged as a stacked imbalance in the footprint, meaning the distribution of aggression within that bar was lopsided even though the net print looks minor. This showed up around the 24,180–24,200 zone, essentially a probe back toward the developing Point of Control. Like the first attempt, it produced no follow-through — the bars immediately after turned positive again (36, 64, 121, 208), and the index continued its slow climb.
Two failed sell attempts in one session, at two structurally logical levels — the prior Poor High and the developing POC — is a meaningfully different signal than one failed attempt. It suggests sellers had genuine reasons to test both spots and came away empty both times, which is a stronger continuation signal than either failure would be in isolation.
Afternoon — the push into a fresh Poor High
The early afternoon carried a brief pause, including the session's only real negative print in this window (-1), but this reads as consolidation rather than distribution — there's no size behind it, and it's immediately followed by acceleration: 612, then 1.38K, then 925, then 272, then 892 into the close.
This closing sequence is where the session's real conviction shows up. A late imbalance cluster built up in the footprint near the R2 zone and above, in the 24,220–24,260 range — stacked prints in the 500–800 lot range appearing right as price broke into new high ground. This matters because it rules out the least healthy version of a breakout: a low-volume drift into new highs with no real participation behind it. What actually happened was the opposite — aggressive buying showed up precisely where it needed to for the move to be structurally sound, and the index closed pinned near its highs rather than fading off them.
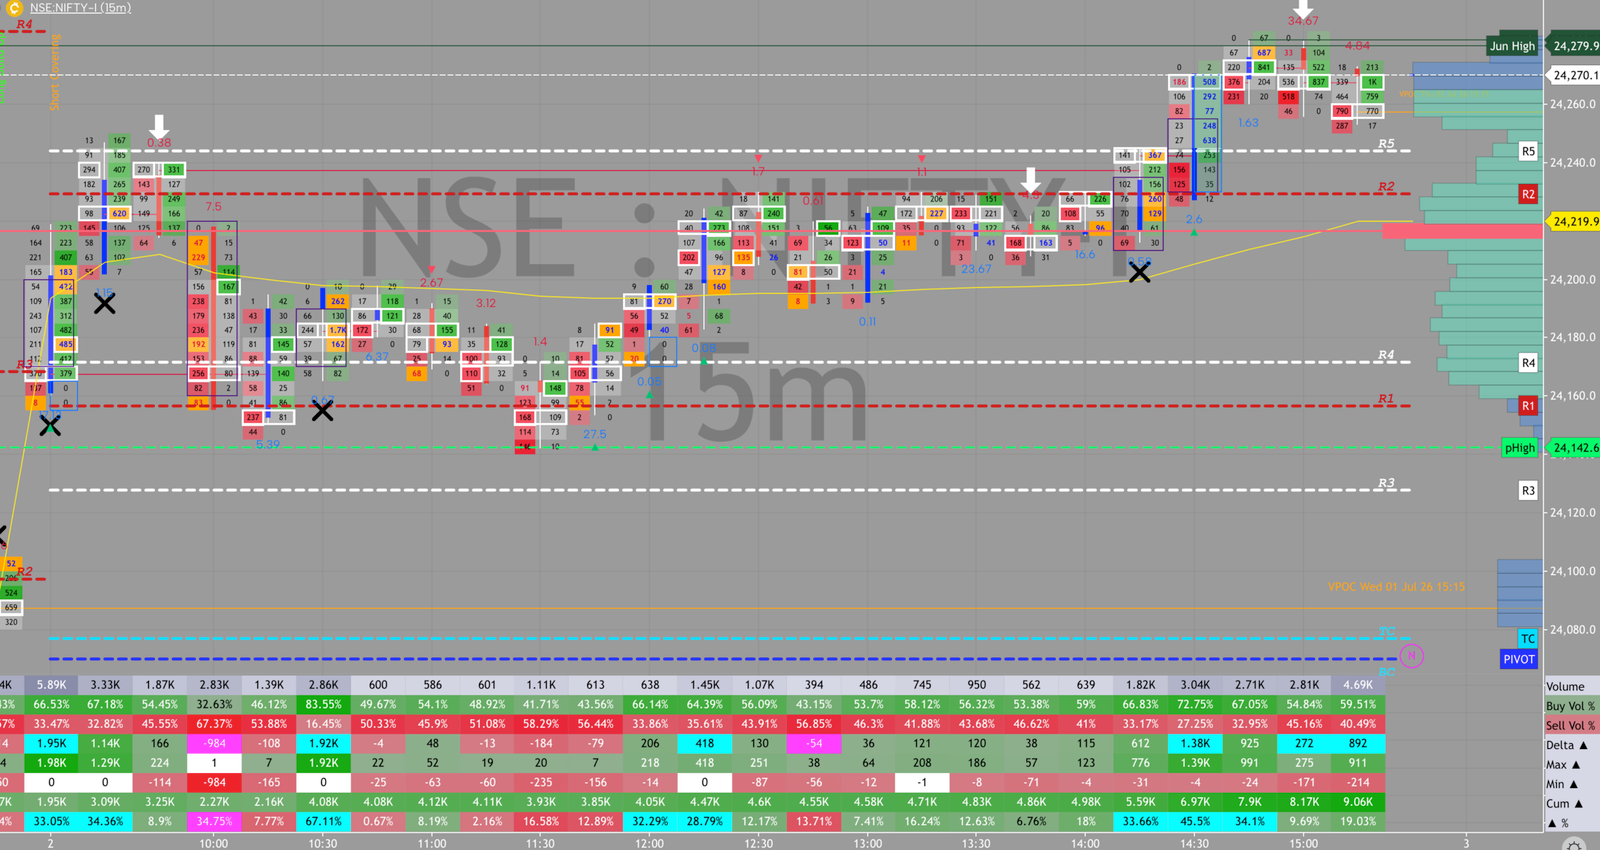 Order flow footprint, NIFTY 15m — July 2, 2026.
Key Order Flow Takeaway
- Two structurally logical sell attempts (prior Poor High at 24,142.6, developing POC near 24,180–24,200) both failed against resting size, and both were followed by immediate, disproportionate buy-side responses.
- The session's largest single delta print (+1.92K) came directly off the first failed sell attempt — the reversal was not gradual, it was a single decisive bar.
- The close carried genuine size, not just drift — the late imbalance cluster into 24,220–24,260 confirms real participation behind the push into the new high, not a thin breakout.
Market Profile Analysis
Thursday's profile built as a clean, single-direction distribution above Wednesday's entire range — not a split or double-distribution shape, which is consistent with the order flow read of one contested level early and then uncontested movement afterward. A split profile would suggest the market changed its mind mid-session; this one didn't.
Point of Control settled around 24,200, with Value Area High at 24,231 — both comfortably above Wednesday's value area, confirming the day traded as genuine range extension rather than a return to balance. Price pushed beyond VAH into a fresh single-print zone in the 24,270–24,300 band, which the profile tags as a Poor High: an extreme that hasn't been tested twice and therefore lacks the two-sided rejection that would mark it as resolved.
Comparing today's structure to Wednesday's: Wednesday's session left its own Poor High markers around 24,144.9–24,151, both of which today's session traded straight through without hesitation — effectively resolving Wednesday's unfinished business on the way to creating its own. This is a pattern worth watching for Friday: today's unresolved high may get treated the same way tomorrow.
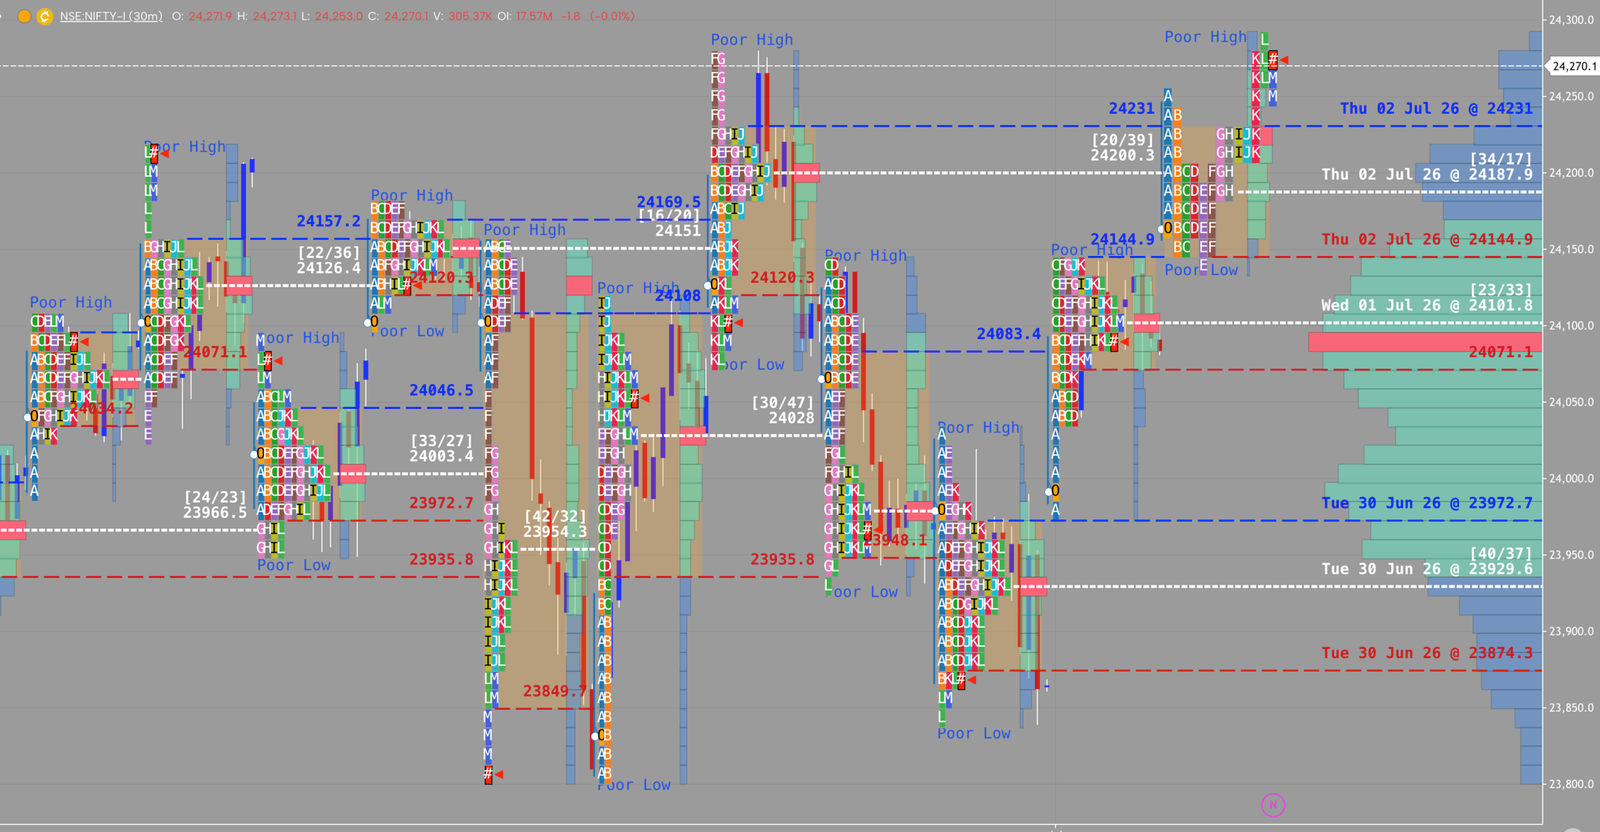 Market Profile (TPO), NIFTY 30m, multi-session view — July 2, 2026.
Structural Levels
- 24,270–24,300 — today's fresh Poor High, unresolved, first level to watch on any continuation
- 24,231 — today's Value Area High, first support on a pullback
- 24,200 — today's Point of Control, the level the market spent the most time accepting
- 24,144.9 — today's Value Area Low
- 24,142.6 — prior session's Poor High, now a proven absorption zone after today's failed sell attempt
- 24,180–24,200 — site of the second failed sell attempt (flagged -54 imbalance bar), secondary support
- 24,231–24,260 — the zone where the late imbalance cluster built into the close, likely near-term support if retested quickly
- CPR pivot zone (~24,080–24,090) — today's open, now a distant reference rather than an active level
Trading Implications
Continuation scenario: Given the order flow showed genuine conviction into the close rather than drift, a retest and acceptance above 24,270–24,300 would resolve today's Poor High and likely open room toward fresh highs without much overhead resistance in the way.
Retest-and-hold scenario: A pullback into the 24,200–24,231 band (POC/VAH) that finds buyers again would be the healthiest version of a continuation — confirming today's breakout was structural, not a one-day extension. Given how decisively 24,142.6 absorbed selling today, I'd treat a deeper pullback into that zone the same way: as a level to watch for continuation, not one that breaks just because it gets tested again.
Failure scenario: If Friday opens and immediately loses the 24,200 POC without a fight, that would be the first real evidence that today's move ran ahead of itself — worth taking seriously given how one-sided the session was, since one-sided sessions can occasionally mark short-term exhaustion even when the underlying order flow was genuine.
Conclusion
Today wasn't a day defined by a dramatic move — it was defined by what didn't happen. Sellers had two legitimate chances, at two well-chosen levels, and came away with nothing both times. That's a more informative session than a big trend day with obvious cause, because it shows you exactly where the market's actual conviction sits rather than just where price ended up.
Friday's first task is simple: does 24,270–24,300 get resolved, or does it become the top of a range that needs more time to digest today's move. Either answer will tell you something real.
— Shak