
Wednesday–Friday, July 15–17, 2026 — A Sideways Stall, a Round-Trip Reversal, and a Breakout to Fresh Highs
Market Overview
Confession up front: this is three days pretending to be one post, because I let the Journal go dark right after Tuesday's grind lower. Good news — nothing about the tape over these three sessions rewards being caught up in real time anyway. It was a stall, then a fake-out, then the actual move. Let's take them one at a time.
Wednesday, July 15 opened in the shadow of Tuesday's slide toward the weekly low, tested up into the R1/R2 zone near 24,124-24,166, got firmly rejected there, and spent the rest of the day rotating back down toward the pivot without ever threatening a fresh breakdown. It closed at 24,070 — almost exactly where Tuesday left off. A session that looked, from the candle alone, like nothing happened. The footprint tells a slightly different story: a clean sell-side imbalance stacked right under the morning high, and a buy-side imbalance printed down at the low of the day near 23,993-24,000, which is the only reason Wednesday didn't turn into Tuesday's sequel.
Thursday, July 16 is the one that'll bite you if you only check the close. Cumulative delta built to +2.21K by late morning — real, sustained buying, not a single spike — and by 11:00 the tape looked like a recovery was underway. Then it round-tripped. A -532 print and then a brutal -1.84K delta bar hit right around 13:00-13:30, flipping cumulative delta from +935 to -909 in the space of two bars, and it never got the morning's gains back, sliding to roughly -1.36K by the close. NIFTY finished at 24,098 — up marginally from Wednesday, but the number hides a full round-trip underneath it.
Friday, July 17 is the session that actually mattered. A strong opening delta print, a sharp -1.88K flush mid-morning that looked like it might be Thursday afternoon all over again, and then the tape simply didn't let it stick — buyers answered with a +1.82K push and, later, a standout +2.82K delta bar in the early afternoon. NIFTY closed at 24,344, its best print in weeks, tagging a fresh Poor High at 24,339.8 that the session never got time to fully test before the bell.
Taken together: two days of digestion sandwiching one real trend day. Friday's close sits well above the entire range these three sessions spent fighting over.
Order Flow Analysis
Wednesday, July 15 — rejected at range highs, absorbed at range lows
The session pushed into the 24,124-24,166 zone early and met a clear sell-side imbalance stacked just under the highs — a down-arrow print flagged directly on the footprint, the kind of resting offer that doesn't need a huge delta number to matter, it just needs to hold. From there NIFTY drifted back through the pivot and camarilla cluster (BC/TC/R3 around 24,072-24,080) without urgency — small, alternating delta prints, nothing resembling Tuesday's one-directional grind. The one moment of real conviction came at the session low near 23,993-24,000, where a green up-arrow imbalance (annotated 296 on the chart) marked buyers stepping in size against the drop. That single absorption print is doing most of the work explaining why Wednesday closed at 24,070 instead of extending Tuesday's breakdown.
Thursday, July 16 — a real morning rally that didn't survive the afternoon
This was the most legible reversal of the three days. The morning built cleanly: cumulative delta climbed from an opening +823 through +1.39K, +2.21K, and held above +1.9K through the late-morning bars — a genuine, multi-bar accumulation, not a single print. Sell-side volume percentage stayed under 50% for most of that stretch, confirming buyers were doing the aggressing.
Then, right at the 13:00-13:30 boundary, the tape flipped hard. A -532 delta print landed first, knocking cumulative delta down to +935, and it was followed almost immediately by a -1.84K bar — one of the largest single prints across all three sessions — that dragged cumulative delta straight through zero to -909. Sell-side volume percentage on that bar ran into the 50%+ range with real size behind it, not a thin flush. From there the afternoon just kept leaking: -239, -36, then smaller negative prints through 14:00-15:00, with cumulative delta bottoming near -1.36K into the close. The session closed at 24,098, which — measured against where the morning peaked — represents a genuine giveback, even though the daily candle alone barely shows it.
Friday, July 17 — a flush that failed, then a breakout that stuck
Friday opened with real buying — +1.67K delta in the first bar alone — pushed further to +1.82K shortly after, and then hit a wall: a sharp -1.88K delta print around 11:00 that, on the shape of the last two days, looked exactly like the setup for another afternoon giveback. It wasn't. Buyers answered almost immediately, with cumulative delta stabilizing rather than extending the flush, and by early afternoon the tape produced the standout bar of the week: a +2.82K delta print, easily the largest directional push across all three sessions, arriving with buy-side volume comfortably dominant. From there NIFTY pushed to a session high near 24,339.8-24,364.9, tagging a fresh Poor High that the close (24,344) sits almost directly against — the session ran out of time before the market could confirm or reject that level.
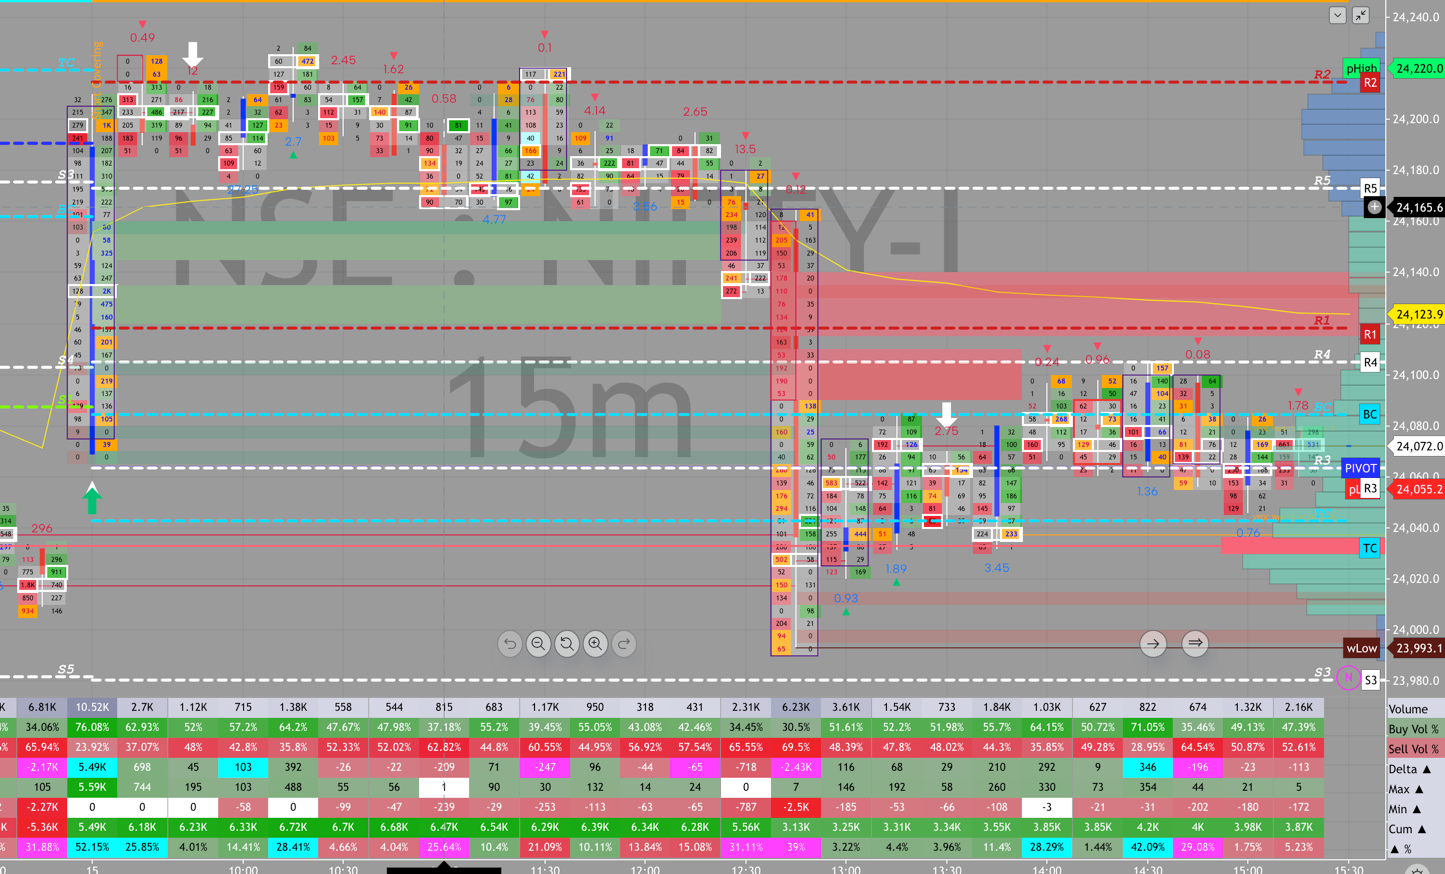 Order flow footprint, NIFTY 15m — July 15, 2026.
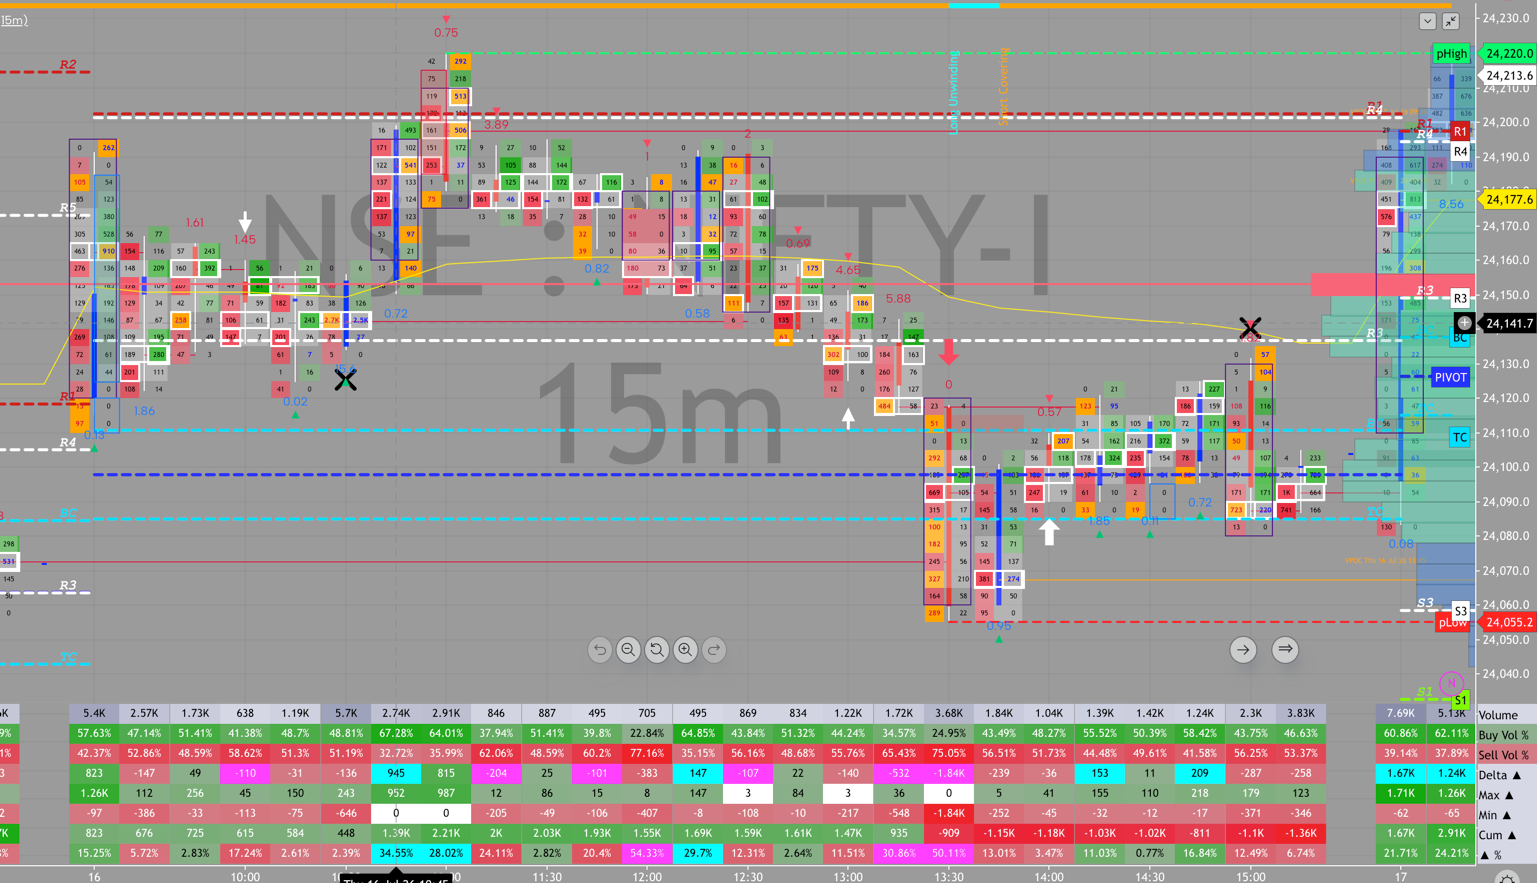 Order flow footprint, NIFTY 15m — July 16, 2026.
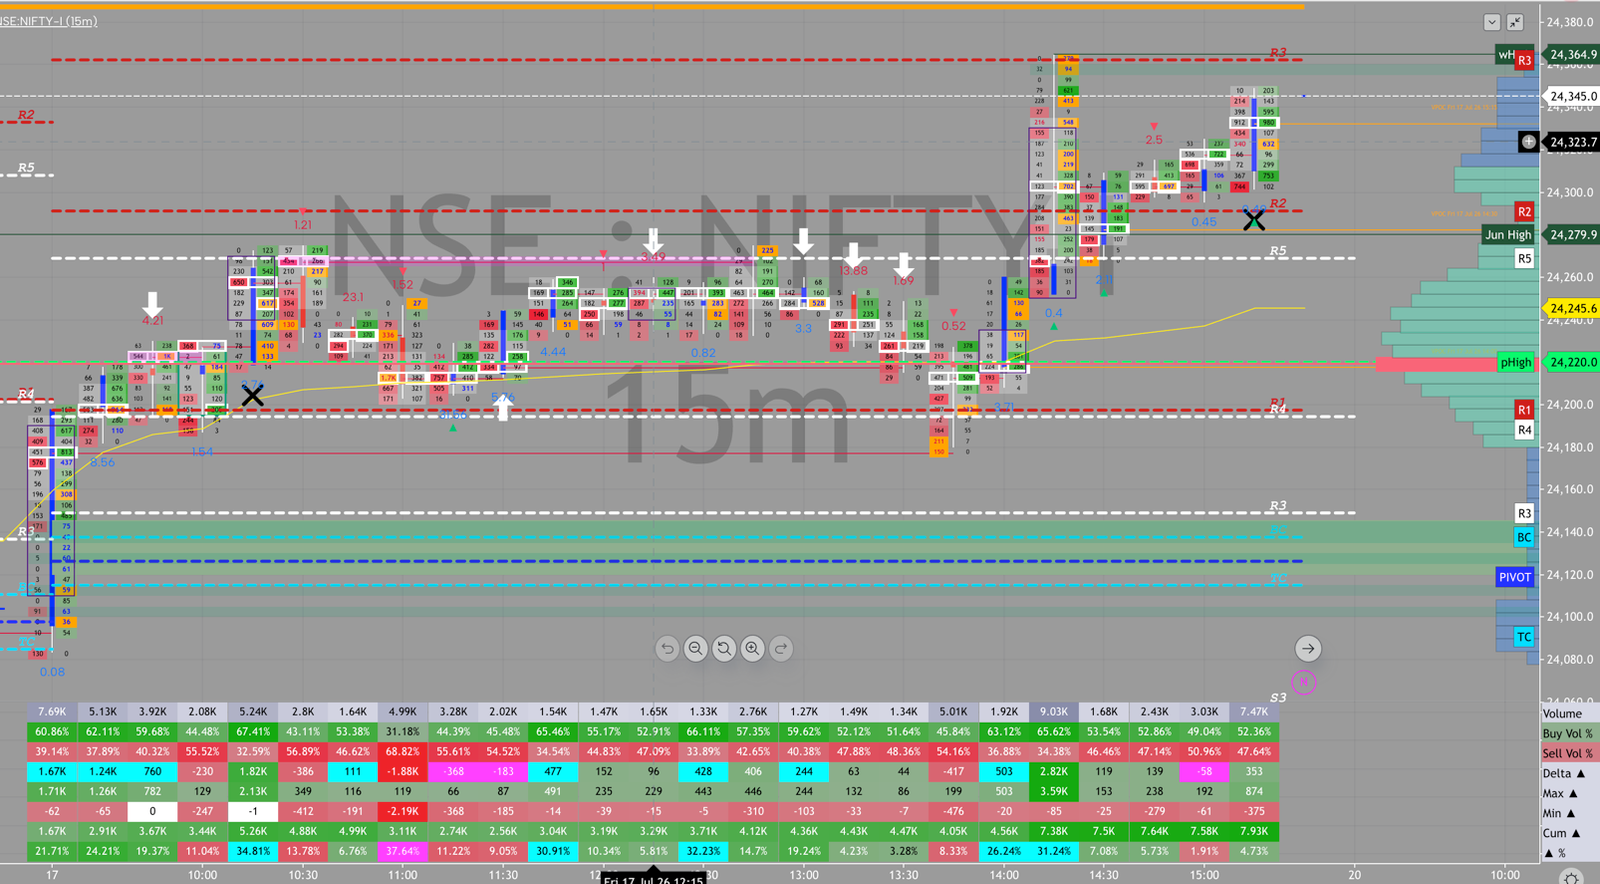 Order flow footprint, NIFTY 15m — July 17, 2026.
Key Order Flow Takeaway
- Wednesday was absorption at both ends of the range — sold at the top (24,124-24,166), bought at the bottom (23,993-24,000) — which is why it closed essentially flat rather than continuing Tuesday's slide.
- Thursday produced a real +2.21K cumulative-delta rally that was fully erased by a two-bar, -532/-1.84K flush around 13:00-13:30 — the clearest round-trip of the week, and the close (24,098) badly undersells how far the tape actually traveled intraday.
- Friday's -1.88K mid-morning flush looked like Thursday's afternoon setup repeating, but it failed — buyers reclaimed control and produced the week's largest single print (+2.82K) on the way to a 24,344 close.
- Zoom out and the three days form a coil-then-release pattern: two sessions trapped inside roughly the same 200-point band, followed by a session that broke cleanly above it.
Market Profile Analysis
Wednesday's developing profile shows a POC around 24,182.6, with value roughly bounded by 24,195.7 on the high side and 24,104 on the low side. A Poor Low tag sits near 24,025-24,038 — an echo of Tuesday's own unresolved low a little higher up, meaning the market spent two straight sessions failing to cleanly reject that zone rather than confirming it as support.
Thursday's profile is harder to isolate cleanly on the combined multi-session chart — its TPO structure overlaps with Wednesday's in a way the annotations mark as a shared, unresolved level (split counts like [19/32] and [25/28] on the chart flag a high or low tested across both sessions rather than resolved on either single day). What's legible is that Thursday's price action stayed contained inside roughly the same 24,090-24,150 band that framed Wednesday, consistent with the order-flow read of a round-trip day that ultimately went nowhere structurally.
Friday broke that containment. A Poor High tag prints at 24,339.8, with the profile's point of control stepping up to roughly 24,274.3 — both well above the 24,090-24,195 band the prior two sessions had built. The Poor High tag matters here specifically because Friday's strong close sits right against it: the session pushed to a new high without time to auction back down and confirm it, which is exactly the setup that either extends cleanly on Monday or gets rejected fast.
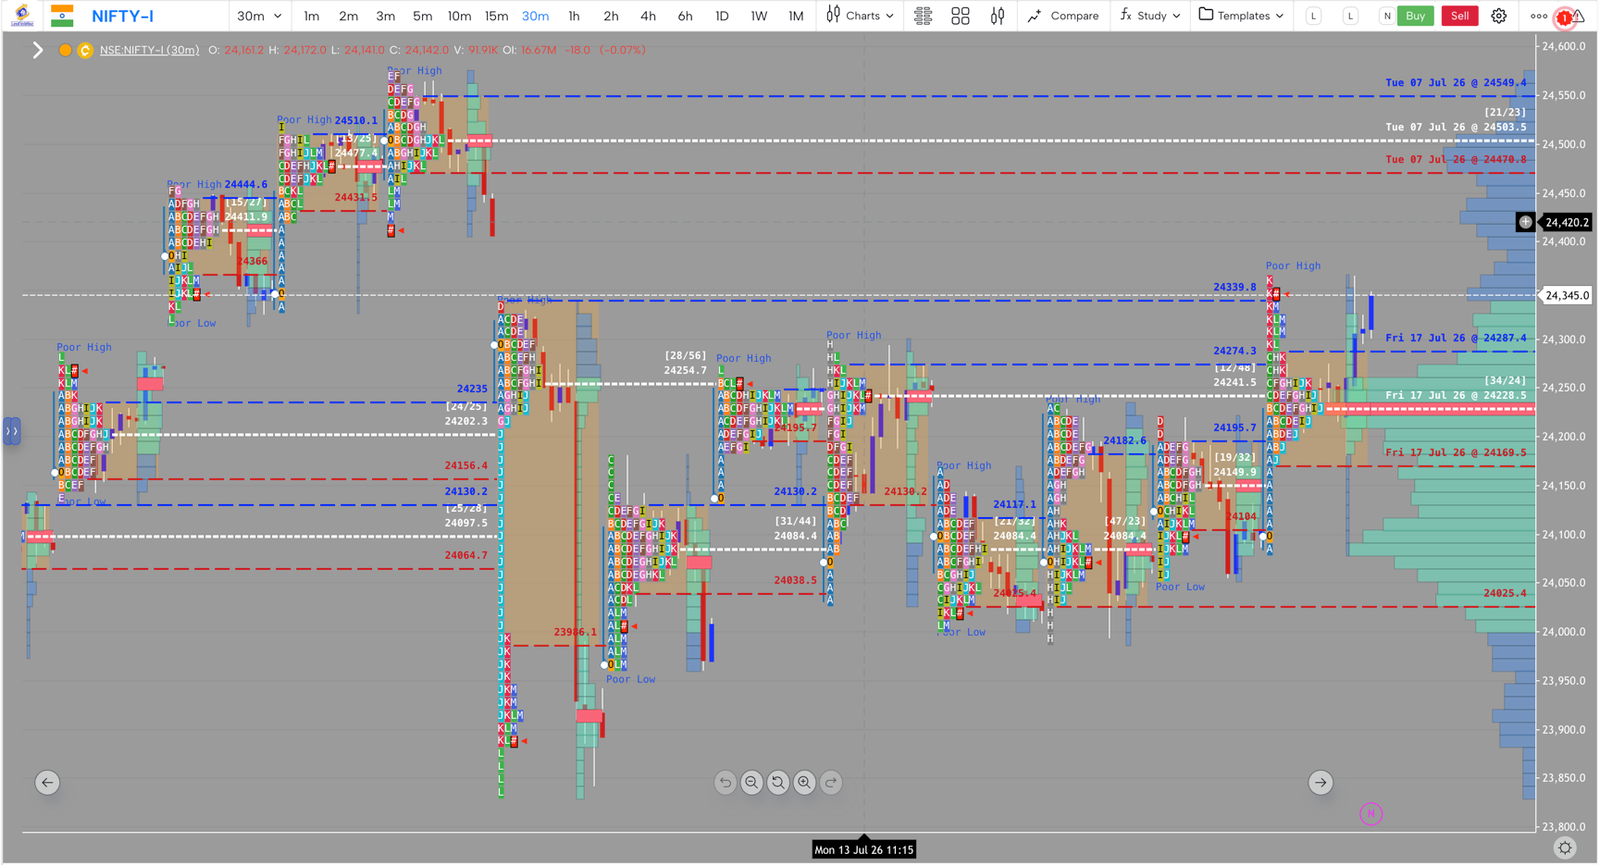 Market Profile (TPO), NIFTY 30m, multi-session view covering July 15-17, 2026.
Structural Levels
- 24,339.8 — Friday's Poor High, unresolved into the close and the most important level for Monday: does it get confirmed as support or does the market retest through it
- 24,274.3 — Friday's developing POC, the fair-value center of the breakout session
- 24,090-24,195 — the band Wednesday and Thursday spent two sessions fighting over before Friday's break; now the first layer of support if Monday gives anything back
- 24,025-24,038 — the shared Poor Low zone flagged across Wednesday and Thursday, still unconfirmed as either a floor or a level that eventually gets swept
- 24,009-24,022 — last week's weekly low zone, now a full range away from price and increasingly a distant reference rather than an active level
- 24,364.9 — the session high tagged Friday, the next level up if Monday extends
Trading Implications
Continuation scenario (breakout holds): A Monday session that opens above 24,274 and holds the 24,339.8 Poor High as support on any pullback would confirm Friday's +2.82K delta push was real distribution of size into higher prices, not a one-bar spike — opening the door toward the 24,400s.
Retest scenario (breakout gets tested, not broken): A pullback into the 24,274-24,339.8 zone that finds buyers rather than sellers would read as a healthy retest of the breakout level — the most likely outcome given Friday's move happened late enough in the session that the market didn't get a full auction to confirm it either way.
Failure scenario (Thursday repeats): A Monday session that pushes through 24,339.8 early and then reverses hard — the same shape as Thursday's own +2.21K-to--1.36K round-trip — would suggest Friday's breakout was itself a flush that needs the 24,090-24,195 band retested before the market means business in either direction.
Conclusion
The real story of these three days isn't the closing prices — it's how little Wednesday and Thursday actually resolved. Two sessions built and erased real conviction (Wednesday's range-top rejection and range-bottom absorption, Thursday's full +2.21K rally given back to -1.36K) without ever breaking the 24,090-24,195 band either way. Friday finally did what the prior two days couldn't: it produced a genuine, size-backed push (+2.82K, the week's biggest print) that closed above the entire range.
Monday's job is to answer the question Friday ran out of time to ask: does 24,339.8 hold as new support, or does this breakout need a retest through the band NIFTY spent two sessions building before it's believable.
Related: this three-day stretch picks up right where Tuesday's grind toward the weekly low left off — worth reading together to see the full arc from Tuesday's one-way selling through Friday's breakout.
— Shak