
Tuesday, August 4, 2026 — Monday's Rally Reverses Hard, Long Unwinding Turns Into Fresh Shorts
Market Overview
Tuesday started exactly where Monday left off — NIFTY opened at 24,684.80, just above Monday's close, and pushed marginally higher to a fresh session high of 24,697.00 within the first few bars. For a moment, it looked like Monday's gap-and-go strength was simply continuing.
It wasn't. What followed was one of the sharpest intraday reversals in weeks — a steady, accelerating slide that took price from that early high all the way down to 24,500.00, a nearly 200-point round trip, before the session finally stabilized into the close at 24,552.30, down 97.10 points (-0.39%). Roughly half of Monday's 196.80-point advance was given back in a single session.
The order flow tells a two-act story that matches the chart's own annotations almost exactly: an early stretch marked "Long Unwinding" — profit-taking from Monday's rally rather than outright aggression — that gradually built downward momentum, followed by a clearly marked "Short Build Up" phase around midday where fresh selling pressure took over and did the real damage. This wasn't a single panic print. It was a session that lost its footing early and then had that weakness actively reinforced by new short positioning.
Order Flow Analysis
The early top and long unwinding
The first few bars carried genuinely strong buying (+490, -262, +287), enough to tag the marginal new high at 24,697.00. But the strength didn't hold — a sequence of soft negative prints (-401, -257, -207) followed almost immediately, the start of the stretch the chart itself labels "Long Unwinding." This is a specific kind of weakness: not aggressive selling, but existing long positions from Monday's rally being closed out into strength, which quietly removes the buying support a market needs to hold new highs.
The turn: short build-up takes over
Through the late morning the tape stayed mixed (+150, -19, +99, +191) before the character of the session changed decisively. A run of consistently negative prints — -569, -907, -141, -610, -528, -372 — marked the point where unwinding gave way to genuine fresh selling, the "Short Build Up" phase visible directly on the chart. This is the stretch that did the structural damage, breaking price cleanly below the day's pivot and opening reference levels.
The afternoon acceleration
The selling didn't let up — if anything it intensified. -818, -1.13K, -1.18K in succession is the heaviest sustained selling sequence of the day, each print larger than the one before it, dragging cumulative delta to its lowest point of the session. A brief pause (-345, -150) barely interrupted the slide before another heavy print, -1.01K, confirmed sellers were still firmly in control into the mid-afternoon.
Late stabilization
The final bars showed the first real signs of the selling exhausting itself — small positive prints (+23, +297, +156) before a modest -157 into the close. Price found support and held above the session low rather than sliding further, closing at 24,552.30, well above 24,500.00 but still deep inside the day's downside move.
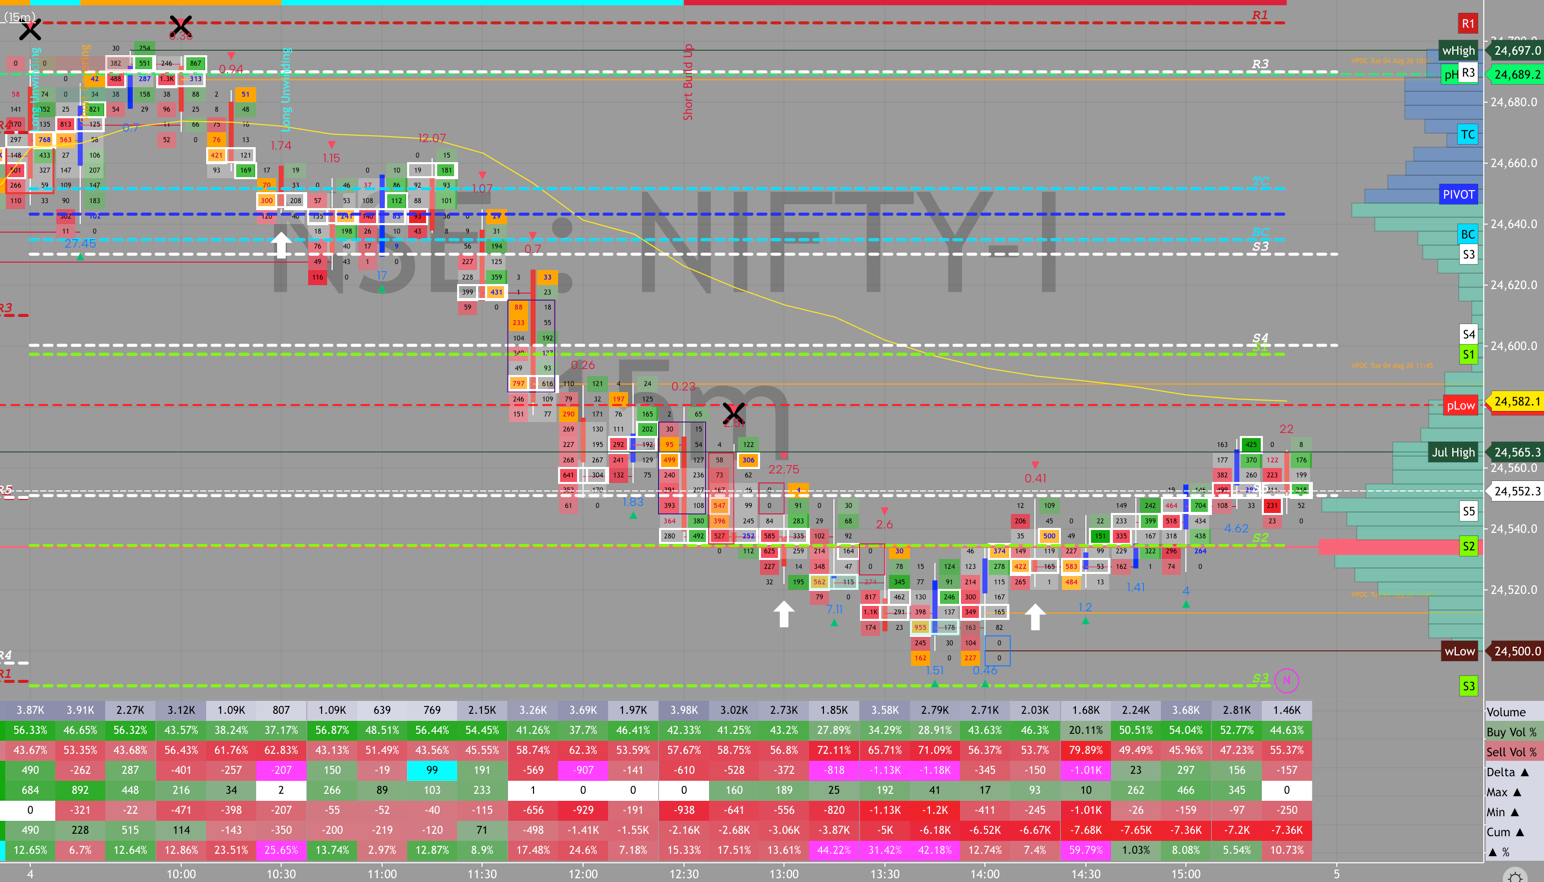 Order flow footprint, NIFTY 15m — August 4, 2026.
Key Order Flow Takeaway
- An early buying burst (+490, -262, +287) tagged a marginal new high at 24,697.00 before fading immediately — the session's high was made on the back of Monday's leftover momentum, not fresh conviction.
- A stretch of consistent mild selling (-401, -257, -207) matches the chart's own "Long Unwinding" annotation — Monday's rally being closed out rather than a new down-move being forced.
- A escalating negative sequence (-569, -907, -610, -528, -372) marked the shift into the chart's labeled "Short Build Up" phase, where fresh selling took over from profit-taking.
- The heaviest prints of the day (-818, -1.13K, -1.18K, -1.01K) all landed in the afternoon, confirming the reversal was driven by sustained, escalating sell pressure rather than one isolated print.
Market Profile Analysis
Tuesday's profile initially extended directly out of Monday's range — the early session built further into the 24,672–24,624 zone, forming another developing Poor High right at the top of that cluster before the reversal took hold. Once the selling accelerated, price moved cleanly out of that upper zone and never returned, leaving Monday's high-value area sitting untouched above the market for the rest of the session.
That's a meaningfully different signature from Monday's profile, which built narrow and high in the range with almost no lower structure. Tuesday's profile instead shows a market that started building on top of Monday's structure, failed to hold it, and then spent the rest of the session working lower — a classic reversal shape, not a continuation one. The prior week's reference levels (Friday's high near 24,470.4, Thursday's near 24,364.8, and the 28th's near 24,028.8) remain untouched beneath today's range, still available as support if the slide continues.
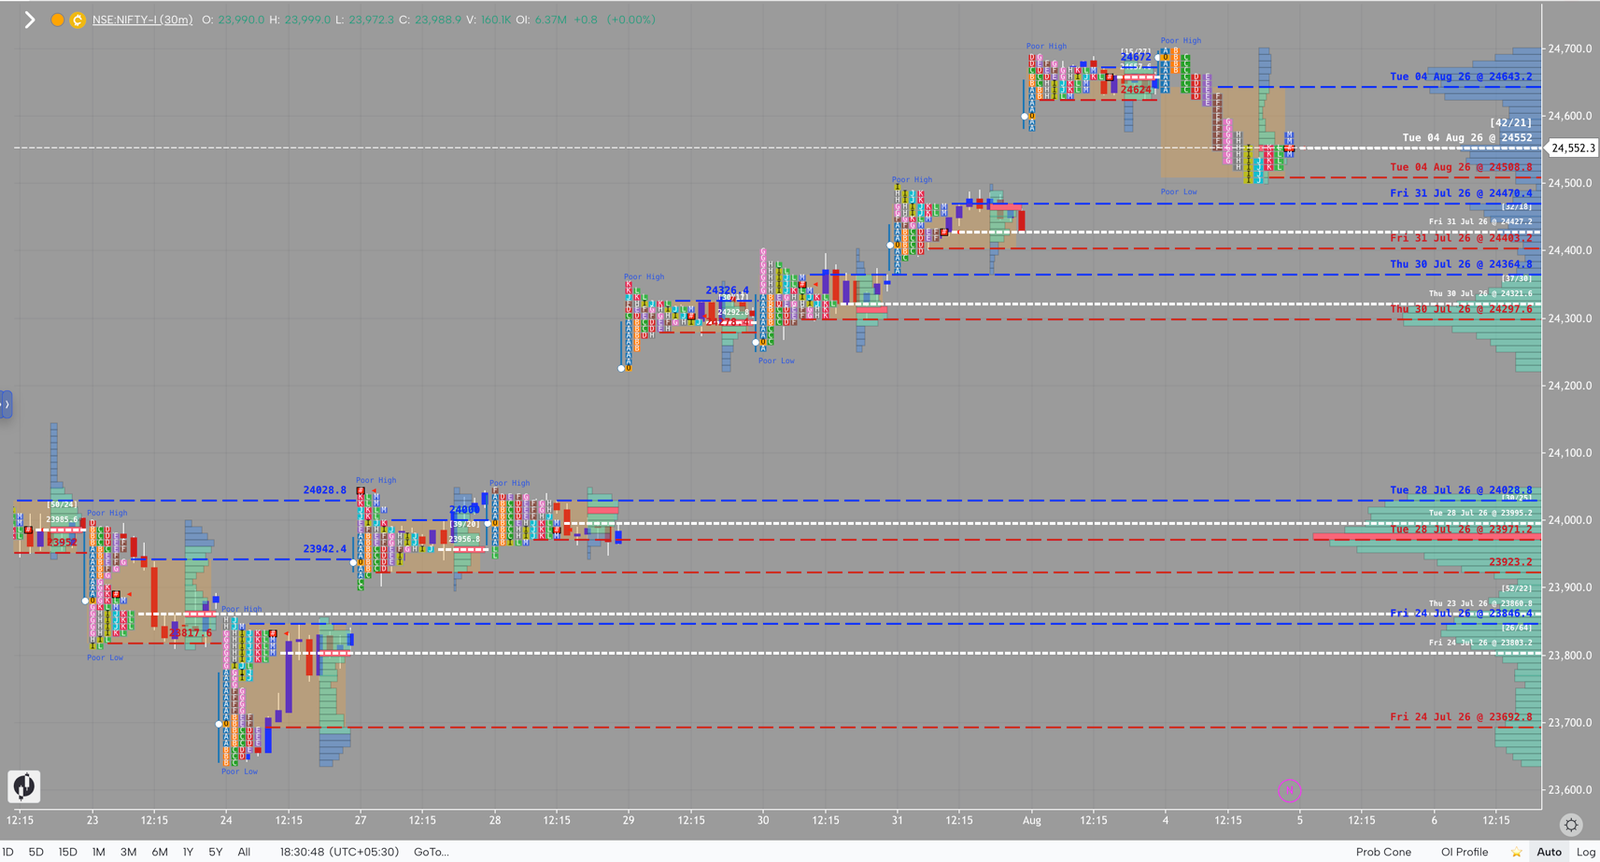 Market Profile (TPO), NIFTY 30m — August 4, 2026, developing session.
Structural Levels
- 24,697.00 — today's high, made early and never revisited; now the level that needs reclaiming to suggest Tuesday's selling was a one-day event rather than a genuine turn.
- 24,684.80 — today's open; price never closed back above this level after the early push, a sign of how one-sided the session became.
- 24,552.30 — today's close, roughly midway through the day's range — neither a strong close nor a full breakdown.
- 24,500.00 — today's low, where the selling finally found buyers; the level that matters most on any follow-through Wednesday.
- 24,470.4 — Friday's high, sitting untouched just below today's close as the next real support reference.
- 24,364.8 — Thursday's high, the next level down if 24,470.4 doesn't hold.
Trading Implications
Reversal-confirmed scenario: A Wednesday session that opens below 24,552.30 and fails to reclaim 24,684.80 would confirm today's move was a genuine change in control, not just profit-taking, with 24,470.4 as the next real test.
One-day-event scenario: A session that reclaims 24,684.80 with genuine buy-side delta — not just a gap-up open — would suggest Tuesday's long unwinding and short build-up have both run their course, and Monday's breakout structure is still intact underneath the noise.
Breakdown scenario: A close below 24,500.00 would mean today's low failed to hold on a retest, opening a path toward 24,470.4 and below with real conviction behind the move.
Conclusion
Tuesday answered a question Monday's strength hadn't tested yet: what happens when a strong rally meets a session with no fresh buyers left to push it further. The early high at 24,697.00 was made on inertia, not conviction, and the moment that inertia ran out — visible in real time as the market's own chart flagged "Long Unwinding" turning into "Short Build Up" — nearly 200 points came off in a matter of hours. The close at 24,552.30 keeps the week's structure technically intact, but Wednesday needs to show whether today was a healthy reset after a strong move, or the first real sign that the rally has run out of road.
Related: this session reverses Monday's gap-and-go breakout — together they're a reminder that the print immediately following a strong session is often the more informative one.
— Shak