
Two Different Games, Same Portfolio: How Trading and Investing Actually Work Together
Somewhere along the way, personal finance content decided this had to be a fight. One camp says index funds and time in the market, don't touch anything else, trading is a casino with extra steps. The other says the real money is made by people who actually work the tape — why settle for the index's 12% a year when a good trader can do that in a month.
Both sides are answering a question nobody should have asked in the first place: which one is right? Wrong question. They're not competing answers to the same problem — they're two different tools solving two different problems, and the actual mistake most people make isn't picking the wrong one, it's not understanding that they need both, sized correctly, and kept firmly apart.
I do both. On purpose. With a wall between them thick enough that a bad trading week literally cannot touch the money that's supposed to still be there in twenty years. Here's how that's actually structured, not as advice — as the framework I use, with real numbers behind it.
What investing is actually for
Investing — index funds, long-horizon equity, the boring stuff — does exactly one job well: compounding, with almost no attention required. You put money in, you leave it alone, decades do the rest. The entire value proposition is that you don't have to be good at anything except not touching it.
This is the core of a portfolio, and it should be the majority of it — 70 to 80% is a reasonable range for most people, more if you're risk-averse or closer to needing the money. It's not the exciting part of this article, and it shouldn't be. Its whole job is to sit there quietly compounding while everything else happens around it.
What trading is actually for
Trading is a different animal entirely, and pretending it's "investing but faster" is where most people get hurt. Trading isn't about long-term compounding — it's a skill-based income stream, closer in nature to a second job than to an investment. You're not betting that NIFTY goes up over ten years. You're reading order flow, market structure, volume — the stuff I write about in the Daily Recap every session — and taking a position based on what the tape is actually telling you today.
Done properly, it generates real, active income on a much shorter timeframe than investing ever could. Done carelessly, it's the fastest way to light money on fire that exists in finance. The entire difference between those two outcomes is discipline — the same discipline I wrote about at length in why I went back to watching every single trade: every entry and exit understood, not just executed.
There's a structural risk benefit here too, worth naming: this satellite is run intraday — every position opened and closed within the same session, nothing carried overnight. That removes a whole category of risk the core is fully exposed to and the satellite simply isn't: a surprise tweet, a weekend geopolitical headline, an overnight move in US markets or crude — none of it can gap the satellite against you, because there's no open position sitting there when the news actually breaks. The core doesn't get that luxury; it's exposed to every one of those gaps by design, which is exactly why it needs time and patience rather than daily attention to absorb them.
The structure: core and satellite
This is the actual mechanism, not a vague "diversify" gesture:
| Core (Investing) | Satellite (Trading) | |
|---|---|---|
| Allocation | 70–80% of total capital | 20–30% of total capital |
| Time horizon | Years to decades | Intraday to a few days |
| Job it does | Compounding, wealth preservation | Active income, skill-building |
| Attention required | Minimal — set and mostly forget | High — every session, every trade |
| What protects it | Time and patience | Risk management, structure (CPR, order flow, market profile), and staying intraday — no overnight/weekend gap risk |
| What a bad month does | Nothing — it's not even watching | Costs real money, but capped by position sizing |
The satellite portion is capital you've genuinely decided you can afford to actively risk — money that, if a strategy has a rough month, doesn't touch your retirement timeline, your core holdings, or your sleep. That firewall is the entire point. Trading only "amplifies wealth" if a loss on the trading side can never force you to touch the core.
What this actually looks like — July, in real numbers
I run a live automated strategy — NIFTY, BankNifty, and Sensex options, 1 lot each — that's the satellite portion of what I do. July was a genuinely good month for it, and I've been posting the full daily log as it happens rather than only after the fact:
23 trading days. 18 wins, 5 losses — a 78% hit rate.
+₹37,252 net, on roughly ₹4.2 lakh of capital required to hold those three positions simultaneously — call it ~8.9% for the month on the capital actually deployed in the satellite.
For comparison, the core side of the same month: NIFTY opened July around the 24,080–24,090 zone and closed the month at 24,452.60 — roughly +1.5% for the index over the same stretch. That's not a fair like-for-like comparison and I want to be upfront about why: the index return is price appreciation on full notional exposure held for a month; the trading return is on margin capital actively worked every session, with real downside risk on the 5 losing days that the index number doesn't carry an equivalent of. They're not the same kind of number. That's exactly the point — one is patient, passive, low-effort compounding; the other is active income that requires showing up.
Put them together and July looked like this: the core did its quiet 1.5%, doing nothing, asking nothing of me. The satellite did its 8.9% on a much smaller slice of capital, asking for daily attention and real discipline in return. Neither number replaces the other. Together, they're a portfolio that's both patient and active — which is the entire idea.
A worked example: ₹10L, split three ways, over a year
Here's the same idea made concrete, with a portfolio size and split that's easy to follow. Say you're starting with ₹10,00,000:
- ₹5,00,000 (50%) into index funds — the long-horizon core, assumed here at a 12% p.a. long-term average (a standard reference point for NIFTY, not a promise). Index funds are the safer end of equity exposure specifically because you're not betting on any single company — you own a slice of the whole index, so no individual business going bankrupt can wipe you out the way a single-stock bet can. That's the entire reason this piece treats the core as the "safe, boring" side of the split.
- ₹4,00,000 (40%) into a liquid fund/Liquid BeES-type instrument — this isn't idle cash sitting in a savings account, and it isn't equity risk either — it's a debt fund, so it carries a different, much lower risk profile than the index leg. Its NAV appreciates daily, referenced here at a conservative 6% p.a., and unlike a savings account it's an asset your broker can actually pledge for margin — meaning this slice can back your trading capital without you needing to set aside a separate pile of cash for it.
- ₹1,00,000 (10%) held as genuine liquid cash — not invested anywhere, not pledged. This is the buffer that absorbs a bad trading day without forcing you to unwind a pledge or sell a core holding at a bad time.
Pledging, in plain terms: most brokers will let you pledge index/liquid-fund holdings and receive usable trading margin against them, at a haircut — you keep ownership and the underlying NAV keeps compounding, but a slice of that value becomes available as margin for F&O trading. That's the mechanism that lets the ₹9,00,000 core+liquid slice do double duty: it keeps growing on its own, and it's what backs the capital actually deployed in the satellite (the same ~₹4.2L used earlier in this piece).
What the satellite earns gets split three ways, every month: 40% back into the index position, 40% into the liquid fund, 20% into the cash buffer — so trading income isn't just sitting flat, it's compounding forward inside the same core it's protecting.
On tax: F&O trading profit in India is treated as non-speculative business income, taxed at your applicable slab rate, not a flat capital-gains rate — this isn't tax advice and your actual rate depends on your total income, but for this illustration I've used 30% as a top-slab reference. (The index and liquid-fund legs aren't taxed here since those are unrealized NAV gains, not income you've actually booked.)
One more thing worth getting right: the margin scales with the core. Pledging isn't a one-time snapshot — as the core (index + liquid fund) compounds, the value available to pledge grows right along with it, so the usable trading margin grows too. That matters, because it means the satellite's contribution doesn't quietly shrink as a share of the total over time — the capital doing the trading keeps pace with everything else.
In practical terms, a growing margin means growing position size — if the pledged capital roughly doubles, the actual lots traded roughly double too (moving from, say, 1 lot each of NIFTY/BankNifty/Sensex to 2 lots each, once there's enough margin to support it). That's not a smooth continuous scale-up — lot sizes are discrete, so it happens in steps as capital crosses each threshold — but the monthly percentage return used in this model already accounts for that scaling: more capital deployed produces proportionally more rupee profit at the same rate, which is exactly what "the margin grows with the core" means in practice.
On the trading rate: an 8–9% monthly return is a genuinely conservative reference point for this kind of strategy, not a best-case number — plenty of months can and do land higher. So rather than picking one figure, here's a stress-tested low case and a conservative case side by side:
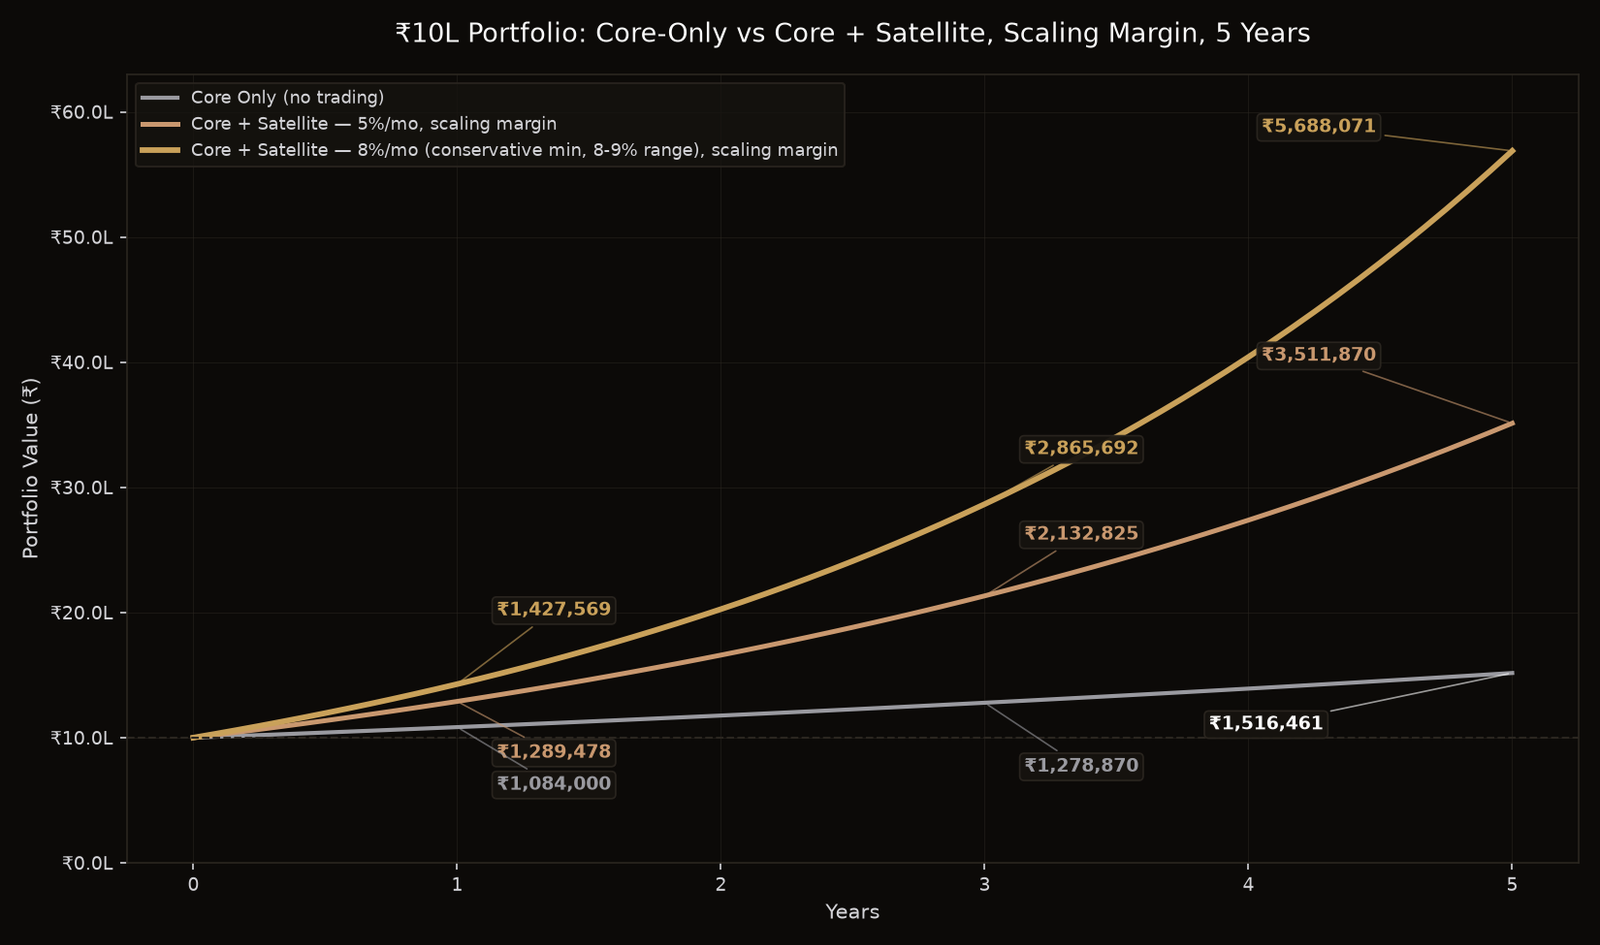 Illustrative only — trading margin scales with the core, income is reinvested monthly (40% index / 40% liquid fund / 20% cash) post-tax. Real trading returns vary month to month and can include losing months; this is not a forecast.
| 1 Year | 3 Years | 5 Years | |
|---|---|---|---|
| Core only — nominal | ₹10,84,000 | ₹12,78,870 | ₹15,16,461 |
| Core only — CAGR | 8.4% | 8.5% | 8.7% |
| Core only — inflation-adjusted (6% CPI) | ₹10,22,642 | ₹10,73,764 | ₹11,33,188 |
| + Satellite, stress case (5%/mo) — nominal | ₹12,89,478 | ₹21,32,825 | ₹35,11,870 |
| + Satellite, stress case (5%/mo) — CAGR | 28.9% | 28.7% | 28.6% |
| + Satellite, stress case (5%/mo) — inflation-adjusted | ₹12,16,489 | ₹17,90,761 | ₹26,24,274 |
| + Satellite, conservative min (8%/mo) — nominal | ₹14,27,569 | ₹28,65,692 | ₹56,88,071 |
| + Satellite, conservative min (8%/mo) — CAGR | 42.8% | 42.0% | 41.6% |
| + Satellite, conservative min (8%/mo) — inflation-adjusted | ₹13,46,763 | ₹24,06,090 | ₹42,50,458 |
Two things worth noticing in that table. First, the CAGR stays roughly flat across all three horizons in both trading scenarios — 28.6–28.9% at the 5%/month stress case, 41.6–42.8% at the 8%/month conservative case — which is exactly what you'd expect once the satellite's capital is allowed to grow alongside the core instead of staying fixed: reinvested income compounds, it doesn't fade. Second, the gap between 5%/month and 8%/month isn't small — by year five it's the difference between ₹35L and ₹57L, which is exactly why the actual monthly rate you can sustain matters more than almost anything else in this model.
The honest caveat, stated plainly: even the "conservative" 8%/month case assumes that rate holds for 60 straight months without a genuinely bad stretch. It won't, not perfectly — this piece already showed you 5 losing days inside one strong month, and five years will include entire periods that look nothing like a normal month, backtest or otherwise. The chart isn't a forecast of what you'll make; it's an illustration of how the mechanism compounds when the satellite is actually working, at two different honest paces, so you can see the shape of the range rather than one cherry-picked number. Treat the core-only line as the reliable case, the 5% line as a genuine stress test, and the 8% line as "what a disciplined, consistent process can add on top" — not a guarantee.
Disclaimer: This is not investment or tax advice. Every number in this section — the 12% index assumption, the 6% liquid-fund/debt-fund assumption, the 30% tax slab, the 5% and 8% monthly trading-return scenarios, the assumption that a scaling margin and a chosen monthly rate hold for years at a time, and the 6% inflation figure — is an illustrative input chosen to show how a core-satellite structure with pledging mechanically compounds, not a prediction of what any of these instruments, this strategy, or this site's author will actually return. Index funds and debt funds carry real risk and can lose value; pledging securities for margin carries the risk of a margin call or forced liquidation if the pledged value falls; F&O trading carries substantial risk of loss, including on the satellite portion of this model, and past performance (mine, backtested, or anyone else's) does not indicate future results. Tax treatment depends on your personal circumstances — consult a qualified tax professional before making any decisions based on this. Nothing on this site is a recommendation to buy, sell, or hold any security or instrument.
If you're actually deciding how to split this
A few honest starting points, not a formula:
- If you can't watch the market daily, your satellite should be near zero. Trading capital you can't actually pay attention to isn't trading — it's gambling with extra steps, which is exactly the accusation the "just index" camp levels at trading in general, and in this case they'd be right.
- Size the satellite as money you can lose without changing your life. Not "money I'd rather not lose" — money that, gone, doesn't move your retirement date or your rent.
- Reinvest trading income into the core, don't let it become lifestyle inflation by default. Some of it can be spendable — you earned it — but treating all of it as spending money means the "amplify wealth" part of this never actually compounds anywhere.
- The core doesn't need your skill. The satellite runs entirely on it. If you haven't put in the hours on structure — CPR, order flow, market profile, whatever your framework actually is — the satellite isn't a smaller, safer version of trading. It's the same risk, just with less money on it.
The actual takeaway
Investing and trading aren't rivals. Investing is what happens while you're not paying attention. Trading is what happens because you are. A portfolio that only does one of those is either compounding too slowly to ever feel urgent, or exposed to a bad month with nothing quietly building underneath to absorb it. Run both, keep them separated by a wall neither side can cross, and let each one do the one job it's actually good at.
Related: the framework behind the trading side is unpacked in the CPR/Order Flow/Market Profile piece, and the discipline behind actually running it live is in why I went back to watching every single trade.
If this was useful, follow the page on Facebook — it's the easiest way to catch new pieces like this one as they go up, and helps this reach more people than just whoever happens to land here directly. And if there's a specific number, comparison, or scenario you want actually worked through properly — a different capital size, a different rate, a different split — tell me and I'll dig into it when I've got the time. Genuinely happy to run it.
The core is supposed to be boring. If most of this piece was too, that's a compliment — it means the math is doing its job quietly while the interesting 10-20% earns its keep. Drop me a note if you want to argue about where your own split should sit; I promise better conversation than my liquid fund.
— Shak