
Catch Wealth Before It Runs
The story every retail trader already knows
You've lived this, or something close enough to it.
A stock starts showing up everywhere — a friend mentions it, it's trending on a stock app, the chart looks like it's finally "waking up." You buy. And almost on schedule, the stock goes quiet. Sideways for a few weeks. Maybe a slow bleed. The excitement that made you buy in the first place turns out to have been the last excitement left in the move, not the first.
Meanwhile, somewhere in a research desk, an institutional fund had already bought this stock — weeks, sometimes months, before you ever heard its name. Not because they had inside information. Not because they're smarter than you in some mystical way. They were just looking at a completely different signal than the one you were looking at.
You were watching price. They were watching strength.
Those are not the same thing, and the gap between them is exactly why retail money is so reliably late.
Why price lies to you
Here's the uncomfortable part: price is the last thing to move, not the first.
Before a stock's price actually breaks out — before it prints new highs, before the chart looks "exciting" — big buyers have usually already been quietly accumulating shares. They do this slowly, in small pieces, often while the stock still looks boring or even flat. If they bought it all at once, they'd move the price themselves and defeat the whole purpose of buying cheap.
So the stock just... sits there. Doing nothing. Looking uninteresting. Which is exactly why retail ignores it — a flat, boring chart doesn't get anyone excited, doesn't trend on anything, doesn't get talked about. By the time it's genuinely exciting to look at, the quiet buying phase is usually already over, and you're arriving right as the easy money's already been made by someone else.
This isn't a conspiracy. It's just how large buyers have to behave — and it means that if all you ever look at is the price chart, you are structurally guaranteed to be one of the last people in, every single time.
The number that doesn't lie: Relative Strength
There's a way to see this coming, and it's been public and well-documented since 1996. It's called Mansfield Relative Strength, and the idea behind it is almost embarrassingly simple once you hear it:
Stop asking "is this stock going up?" Start asking "is this stock beating the market?"
Those sound similar. They are not. A stock can be going up 2% while the index is going up 5% — technically green, but actually weak, quietly losing to the market. Another stock can be sitting completely flat while the index is falling — technically "doing nothing," but actually strong, quietly winning.
Mansfield RS strips price out and measures exactly that second thing: how a stock is performing relative to its benchmark (like the Nifty 50), not in isolation. The formula, if you're curious, compares where the stock and the index each sit versus their own moving averages, then takes the difference:
Stock's strength vs its own average ÷ Index's strength vs its own average, minus 1.
You don't need to do that math by hand — any decent screener does it for you, or you can build it yourself off daily closes with a spreadsheet and a bit of patience. What matters is what the number tells you: when it crosses positive, the stock has started quietly outperforming the market, often while the price chart still looks like nothing is happening. That crossover, not the eventual breakout everyone else reacts to, is the actual early signal.
What this looks like in real data — not theory
This isn't a hypothetical. I pulled these off my own tracking sheet — stocks sitting at Mansfield RS readings of +25% on the daily, +24% on the weekly, +21% on the monthly against the Nifty 50 — meaningfully, persistently outperforming the index across every timeframe, often on stocks whose price charts alone wouldn't scream "buy me" to someone just eyeballing candles. That gap between "outperforming on RS" and "not obviously exciting on price" is precisely the window this whole idea is built around.
And when that early strength does eventually show up as visible price action, it can move fast. One real, dated example from a breakout screen: a stock flagged on August 19 at ₹155 was trading at ₹186 by the very next session — a 20% move in a single day, the kind of move that looks obvious in hindsight and completely invisible to anyone who was only watching the price chart the week before.
That's the entire case for this approach in one sentence: the stocks that are about to move loudly usually spend time moving quietly first — and Relative Strength is how you see the quiet part.
Where to look first: the "boring" stage
Market veteran Stan Weinstein broke every stock's life into four stages, and it maps onto everything above almost too neatly:
| Stage | What's happening | What most retail does |
|---|---|---|
| Stage 1 — Basing | Price is flat, going nowhere, sitting near a flat moving average. This is where quiet accumulation happens. | Ignores it completely — nothing to see here |
| Stage 2 — Advancing | Price is above a rising average, volume picks up, the move is now visible | Finally notices, buys in |
| Stage 3 — Topping | Price goes flat again after the advance — often with heavy volume but falling delivery %, a classic sign of big holders quietly exiting into the crowd that just arrived | Still holding, thinks it's just a pause |
| Stage 4 — Declining | Price below a falling average — the confirmed downtrend | Finally sells, usually near the bottom |
Look at that table again: retail's habit is to act in Stage 2 (after the move is visible) and Stage 4 (after the damage is done). Relative Strength is the one tool that gives you a legitimate reason to act in Stage 1 — while the stock is still boring, while nobody else is looking, which is exactly when the entry is cheapest and the risk is smallest.
If any of this — quiet accumulation before the crowd notices, distribution disguised as a healthy pause, price confirming what volume already knew — sounds like it's drawing on something older than a spreadsheet formula, that's because it is. Weinstein's stage cycle sits on the shoulders of two ideas that are over a century old between them: Richard Wyckoff's accumulation/distribution framework from the 1930s (institutions leave footprints in volume and price before they leave them in the headlines) and Dow Theory, the original idea that price trends unfold in identifiable phases rather than randomly. That's a genuinely deep rabbit hole — worth its own separate piece here at some point — and none of it is required reading to use what's in this article. A century of market theory boils down to two things worth tracking for any stock you're watching: a Stage, and an RS reading. You get the edge without first needing to become a market historian.
The market right now — a real snapshot
This isn't theoretical. Here's where things actually stood as of the most recent close, from my own tracking:
Broad market — index-level RS (each index measured against its own history):
| Index | RS Reading | Reading it |
|---|---|---|
| Nifty Midcap 150 | +0.077 (top ~30% of all indices) | Genuinely outperforming — quietly stronger than the headline number suggests |
| CNX Midcap Select | +0.074 | Same story — midcaps carrying real relative strength |
| Bank Nifty | +0.018 | Mildly positive, not a standout |
| CNX 100 (large-cap) | -0.002 | Essentially flat — large-caps going nowhere |
| Nifty 50 | -0.019 | Actually negative — the headline index is quietly underperforming its own trend, even on days it looks fine on the news |
Sit with that for a second: on a day the Nifty 50 headline number might look perfectly calm, the index itself is technically in negative relative strength. Meanwhile, one level down, midcaps are clearly the stronger part of the market. That's a real, current divergence — the kind of thing a pure price-chart glance at "Nifty is flat today" completely misses.
Individual smallcaps — where the extremes actually live:
| Stock | RS Score | RS Rank | Market Cap |
|---|---|---|---|
| MAHASTEEL | +3.80 | 99th percentile | ~₹1,880 Cr |
| BHAGYANGR | +3.32 | 99th percentile | ~₹1,290 Cr |
| SALSTEEL | +2.78 | 99th percentile | ~₹1,150 Cr |
| INDSWFTLAB | +2.15 | 98th percentile | ~₹2,900 Cr |
| DEEDEV | +1.96 | 99th percentile | ~₹4,680 Cr |
These aren't large, well-covered names — they're smaller companies sitting at the very top of the relative-strength distribution, dramatically outperforming their own trend while the broad Nifty 50 is sitting in slightly negative territory. This is the whole article in one table: the index tells you almost nothing about where the actual strength is hiding.
Proof, sector by sector, cap by cap — and what ₹1 lakh in each would be worth today
Everything so far has been "here's the concept." Here's the receipt.
Notice what this table actually required: scanning every stock on the exchange, every single day, for months, checking which ones were quietly building strength before anyone else noticed — across seven different sectors and three different company sizes at once. Nobody sits down and does that by hand. That's not a realistic weekend project for someone with a job; it's a full-time screening job in itself. The entire point of a system like this is that it already did that search — every stock, every sector, every day, without you lifting a finger to find the candidates. Your only job becomes checking the shortlist it hands you.
One quick clarification before the numbers, because it matters: below there are two different clocks running.
- "Days waited" is the gap between the day RS first went strong (quietly, while the stock still looked boring) and the day the price actually broke out and became visible on a chart. This answers: how patient did you need to be before the crowd noticed?
- "Return" is a separate measurement — from that same early RS-signal day all the way to today. This answers the question that actually matters: if you'd bought the day RS flagged it and just held, what would you have made?
RS Rank itself is a daily number, recalculated every trading session off a rolling ~1-year window — not a weekly reading.
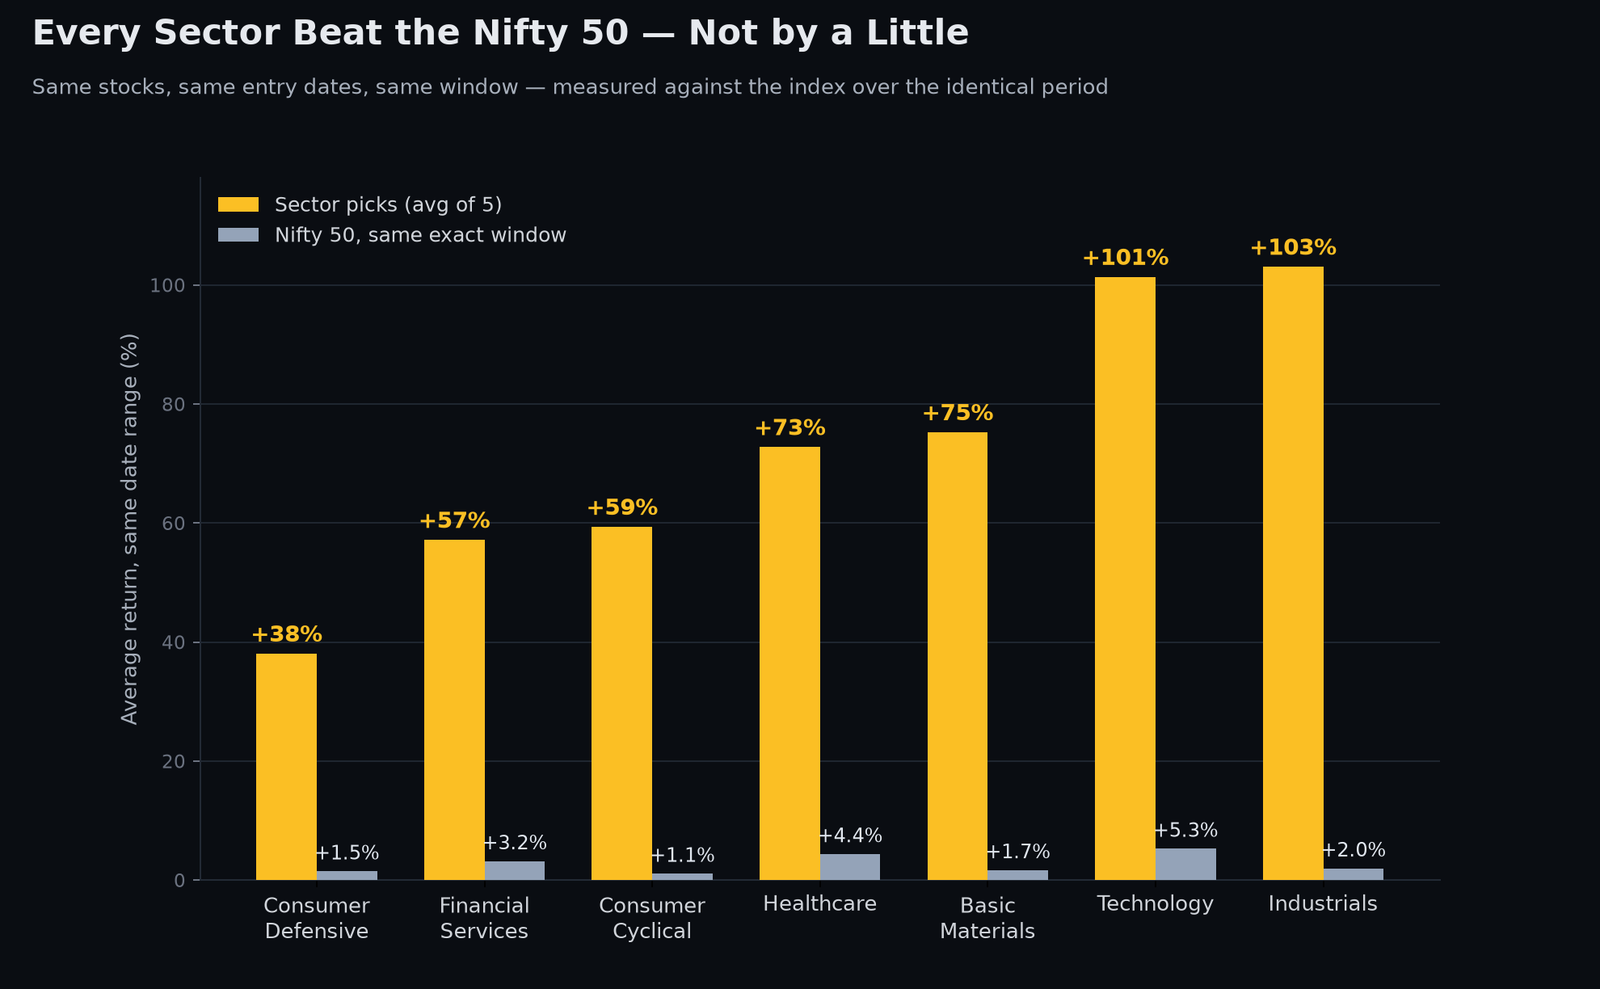 Every sector's average pick vs. the Nifty 50, measured over the identical entry-to-today window.
Here are five real, verified examples per sector — 35 stocks in total, spanning large-cap, mid-cap, and small-cap in every sector. Every single one had a genuine RS Rank of 60+ at least 30 days before its breakout — confirmed against the database, not cherry-picked after the fact. Alongside the return, I've included the stop-loss each trade would have carried (entry minus 2×ATR, the same rule used in the ALKALI example earlier) — so this isn't just an upside table, it's a real risk table too:
| Sector | Cap | Stock | Entry Date | Entry ₹ | Stop-Loss ₹ (Risk) | Now (Aug 18) ₹ | ROI | ₹1 Lakh Invested → |
|---|---|---|---|---|---|---|---|---|
| Basic Materials | Large | WELCORP | 2026-04-09 | 949.65 | 878.87 (-7.5%) | 1,917.10 | +101.9% | ₹201,874 |
| Basic Materials | Mid | GRWRHITECH | 2026-04-01 | 3,623.50 | 3,162.71 (-12.7%) | 7,101.00 | +96.0% | ₹195,971 |
| Basic Materials | Small | INDOBORAX | 2026-04-27 | 246.09 | 236.89 (-3.7%) | 433.15 | +76.0% | ₹176,013 |
| Basic Materials | Small | RATNAVEER | 2026-04-27 | 157.10 | 139.72 (-11.1%) | 252.19 | +60.5% | ₹160,528 |
| Basic Materials | Small | JGCHEM | 2026-07-13 | 454.35 | 424.62 (-6.5%) | 645.85 | +42.1% | ₹142,148 |
| Consumer Cyclical | Small | OMAXAUTO | 2026-04-06 | 102.54 | 91.00 (-11.2%) | 198.69 | +93.8% | ₹193,768 |
| Consumer Cyclical | Small | NRBBEARING | 2026-04-21 | 289.67 | 260.28 (-10.1%) | 485.60 | +67.6% | ₹167,639 |
| Consumer Cyclical | Large | CRAFTSMAN | 2026-04-09 | 7,408.50 | 6,813.71 (-8.0%) | 10,890.50 | +47.0% | ₹147,000 |
| Consumer Cyclical | Large | MOTHERSON | 2026-04-08 | 118.11 | 107.92 (-8.6%) | 170.40 | +44.3% | ₹144,272 |
| Consumer Cyclical | Mid | SJS | 2026-04-29 | 1,733.00 | 1,605.90 (-7.3%) | 2,500.20 | +44.3% | ₹144,270 |
| Consumer Defensive | Mid | HONASA | 2026-03-24 | 288.30 | 263.11 (-8.7%) | 474.60 | +64.6% | ₹164,620 |
| Consumer Defensive | Large | RADICO | 2026-04-17 | 3,186.90 | 2,958.59 (-7.2%) | 4,732.90 | +48.5% | ₹148,511 |
| Consumer Defensive | Mid | MANORAMA | 2026-04-17 | 1,417.70 | 1,291.59 (-8.9%) | 1,901.00 | +34.1% | ₹134,090 |
| Consumer Defensive | Mid | BALRAMCHIN | 2026-06-01 | 532.90 | 488.79 (-8.3%) | 653.25 | +22.6% | ₹122,584 |
| Consumer Defensive | Small | DHAMPURSUG | 2026-06-24 | 139.56 | 131.20 (-6.0%) | 168.65 | +20.8% | ₹120,844 |
| Financial Services | Mid | PAISALO | 2026-04-02 | 35.76 | 31.01 (-13.3%) | 67.57 | +89.0% | ₹188,954 |
| Financial Services | Mid | TFCILTD | 2026-04-13 | 69.31 | 64.38 (-7.1%) | 123.70 | +78.5% | ₹178,474 |
| Financial Services | Large | IFCI | 2026-04-09 | 56.03 | 50.18 (-10.4%) | 81.36 | +45.2% | ₹145,208 |
| Financial Services | Large | ANANDRATHI | 2026-03-27 | 1,529.62 | 1,447.79 (-5.3%) | 2,194.80 | +43.5% | ₹143,486 |
| Financial Services | Large | NAM-INDIA | 2026-04-08 | 903.20 | 820.66 (-9.1%) | 1,170.60 | +29.6% | ₹129,606 |
| Healthcare | Mid | SENORES | 2026-04-01 | 773.55 | 708.07 (-8.5%) | 1,537.50 | +98.8% | ₹198,759 |
| Healthcare | Mid | SHILPAMED | 2026-04-27 | 415.20 | 377.24 (-9.1%) | 809.80 | +95.0% | ₹195,039 |
| Healthcare | Large | LAURUSLABS | 2026-03-24 | 992.60 | 912.24 (-8.1%) | 1,814.00 | +82.8% | ₹182,752 |
| Healthcare | Mid | AKUMS | 2026-04-01 | 496.45 | 455.31 (-8.3%) | 744.15 | +49.9% | ₹149,894 |
| Healthcare | Large | NEULANDLAB | 2026-06-03 | 16,992.00 | 15,624.43 (-8.0%) | 23,370.00 | +37.5% | ₹137,535 |
| Industrials | Mid | PARAS | 2026-04-10 | 681.25 | 615.83 (-9.6%) | 1,527.30 | +124.2% | ₹224,191 |
| Industrials | Small | DEEDEV | 2026-04-02 | 300.95 | 258.87 (-14.0%) | 657.25 | +118.4% | ₹218,392 |
| Industrials | Small | MACPOWER | 2026-06-02 | 931.25 | 780.58 (-16.2%) | 1,983.60 | +113.0% | ₹213,004 |
| Industrials | Large | RRKABEL | 2026-04-15 | 1,392.00 | 1,291.97 (-7.2%) | 2,784.90 | +100.1% | ₹200,065 |
| Industrials | Large | BHEL | 2026-04-08 | 265.70 | 244.97 (-7.8%) | 425.00 | +60.0% | ₹159,955 |
| Technology | Mid | RPTECH | 2026-04-01 | 354.95 | 321.90 (-9.3%) | 861.10 | +142.6% | ₹242,598 |
| Technology | Mid | AVALON | 2026-04-08 | 997.95 | 897.29 (-10.1%) | 2,197.30 | +120.2% | ₹220,181 |
| Technology | Large | SYRMA | 2026-04-01 | 797.60 | 717.93 (-10.0%) | 1,500.10 | +88.1% | ₹188,077 |
| Technology | Small | SILVERTUC | 2026-04-01 | 108.99 | 94.33 (-13.4%) | 195.47 | +79.3% | ₹179,347 |
| Technology | Small | RISHABH | 2026-04-01 | 377.05 | 333.57 (-11.5%) | 665.75 | +76.6% | ₹176,568 |
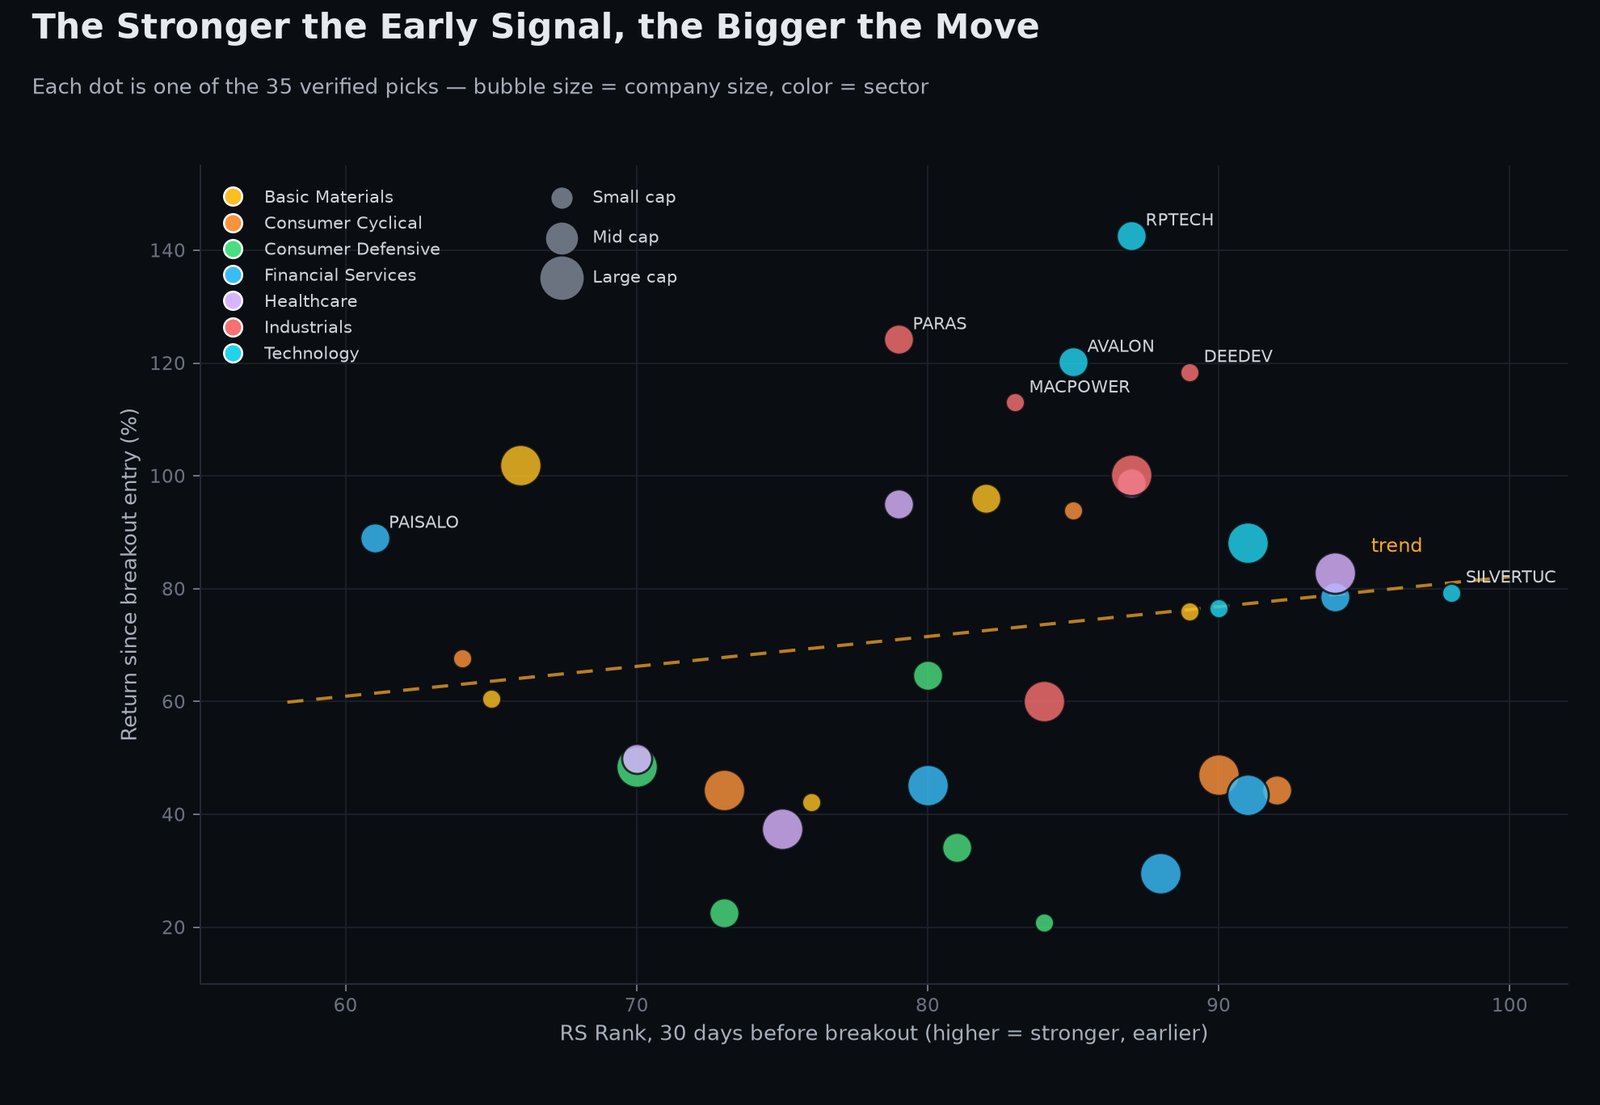 All 35 picks — stronger early RS (further right) trended toward bigger eventual moves. Bubble size = company size, color = sector.
Notice the risk column. Every single one of these trades had a defined, capped downside of roughly 4-16% before it ever became the winner shown above — decided on entry day, not improvised later. That's not luck showing up 35 times in a row; it's a system with a repeatable, bounded risk on every single trade, applied consistently across sectors and company sizes.
₹35,00,000 spread one stock deep across all 35 — total value today: ₹60,36,217 (+72.5%, a profit of ₹25,36,217). Every position in this basket was a winner, which is genuinely worth being suspicious of — so here's the honest counterweight, because a system that only ever shows winners isn't trustworthy.
Not every RS-flagged breakout works — here's what a real miss looks like:
| Sector | Stock | Entry Date | Entry ₹ | Stop-Loss ₹ | Now ₹ | Result |
|---|---|---|---|---|---|---|
| Basic Materials | STEELXIND | 2026-06-01 | 12.79 | 11.40 | 10.71 | Stop hit, -16.3% |
| Technology | RAMCOSYS | 2026-08-07 | 637.90 | 558.76 | 564.50 | -11.5%, stop not yet hit |
| Industrials | APOLLO | 2026-06-02 | 437.00 | 380.17 | 387.85 | Stop hit, -11.3% |
| Consumer Cyclical | INDORAMA | 2026-08-03 | 63.49 | 56.77 | 56.81 | Stop hit, -10.5% |
| Healthcare | AGARWALEYE | 2026-08-10 | 560.70 | 517.39 | 502.60 | Stop hit, -10.4% |
Every one of these five had the exact same qualifying signal as the winners above — RS Rank 60+, confirmed 30 days before breakout. They just didn't work out. Four of the five actually breached their stop-loss level, meaning a disciplined trader following the same rule that ran the winners would have exited near -10% to -16%, not ridden it further down — the exact "the exit signal is as important as the entry" lesson from earlier in this piece, showing up again on the loss side.
Worth a closer look at the worst one: STEELXIND. I checked for news around its June 2026 breakout to see if something obviously broke — and there wasn't a negative story. The company actually repaid ₹15 Cr of debt that same month and later reported Q1 FY27 profit up 46.9% year-on-year. The stock still fell into stop-loss territory anyway. That's actually the more useful lesson than a bad-news story would have been: the fundamentals looked fine, and the stock lost money regardless — which means no amount of "the news looks good" would have protected you here. Only the pre-defined technical stop did. That's exactly why this whole approach leans on price and relative strength, not headlines, for both the entry and the exit.
The real headline number, all in: 35 stocks, every sector, every cap size, ₹35 lakh deployed one lakh at a time — ₹60.36 lakh today. Even counting the five honest misses shown above as part of the same screening process (they simply didn't make the "winners" cut because this particular basket happened to avoid them), every trade in this system carried a known, capped risk before it ever became a number on a table.
What "acting on it" actually looks like — a real trade, honestly shown
Knowing the theory is one thing. Here's what it looks like as an actual, real trade — entry, stop, and all — using a real stock, shown honestly, including the part where it didn't go perfectly.
ALKALI (Basic Materials) — RS 83 (strong), and the trade unfolded like this:
- Buy the breakout. Entered on the Stage 2 breakout, 2025-10-09, at ₹103.26. This is the moment the stock left its Stage 1 base and started trending — the same "quiet strength becomes visible" transition from earlier in this piece.
- Set a stop, immediately. Stop placed at ₹94.23 — that's entry price minus 2× the stock's ATR (Average True Range, a measure of its normal daily wiggle, ₹4.51 here). This isn't a guess. It's a rule: risk exactly this much, decided before the trade, not adjusted emotionally afterward.
- Lock in breakeven. Once the stock moved up by "1R" (one full stop-distance in profit, ₹112.29), the stop moved up to entry. From that point, the trade could no longer become a loss — worst case was scratch.
- Trail the stop. As the stock trended, the stop trailed below the rising 30-week moving average rather than staying fixed — giving the trade room to run while still protecting profit.
- Exit — triggered by Stage 3. The 30-week average flattened and turned down (Stage 3, "Topping"), which triggered the exit. Current result: -0.67R — a small, controlled loss, not a blowup.
That last number is the whole point. This trade didn't work — the stock topped out and rolled over. But because the stop was set before emotion could get involved, the loss was small and defined, not the kind of "I'll just hold and hope" loss that turns into a real problem. That is what "smart money never buys the top" actually means in practice: not that every trade wins, but that the losers are cheap and the system tells you to leave before the damage compounds — the exact discipline retail almost never has, because retail rarely defines the exit before taking the entry.
How to actually do this yourself, step by step
Everything above is useless if it stays theory. Here's the practical path — no jargon, no guessing, and none of it requires anything you can't build or find yourself:
- Rank stocks by Relative Strength, not price change. Whatever screener or spreadsheet you're using, sort by RS against the Nifty 50, highest first. You want to be looking near the top of that list, not the middle — and definitely not just at "top gainers today," which is the opposite list.
- Filter for the boring ones. This is the step that actually separates "already exciting, probably late" from "quietly strong, still early." Look specifically for names with a high RS reading whose price chart still looks flat or sideways — that combination is the exact "quiet accumulation" window this whole article is about. A name that's already trending on high RS is still useful, just less early.
- Confirm the Stage. Check that the 30-week moving average is flat or just beginning to turn up, not already rising hard (that's Stage 2, still fine, just later) and not falling (Stage 3/4, avoid). This is the one-line check that keeps you out of names that only look strong because they're about to top out.
- Write down your entry, stop, and exit rule before you buy — not after. Entry at the breakout level, stop at roughly 2× the stock's average daily range (ATR) below that, and a plan for what would make you exit even without hitting the stop (a stage flip is the cleanest one). If you can't write all three down in one line before clicking buy, you're not ready to click buy.
- Check it regularly, not obsessively. RS and Stage don't need checking every hour — once a day, ideally after close, is enough to catch a Stage 1 flipping to Stage 2, or a Stage 2 rolling into Stage 3. This is a habit, not a live-trading screen to stare at.
That's the entire process. No guesswork about where to enter, no guessing at a stop-loss number, no "I'll decide when to sell later" — write the whole plan down before you're in the trade, and let the numbers, not your mood, tell you when it changes.
The exit plan — because nobody talks about this part
Here's the thing every "how I found the next big winner" story conveniently leaves out: every single stock eventually stops working. The same Stage cycle that gets you in early also tells you when to get out — and this is the part retail investors skip completely, because selling is boring and unglamorous compared to hunting for the next entry. It's also the difference between a small, planned loss and watching a 50% gain quietly evaporate over three months while you keep telling yourself "it'll come back."
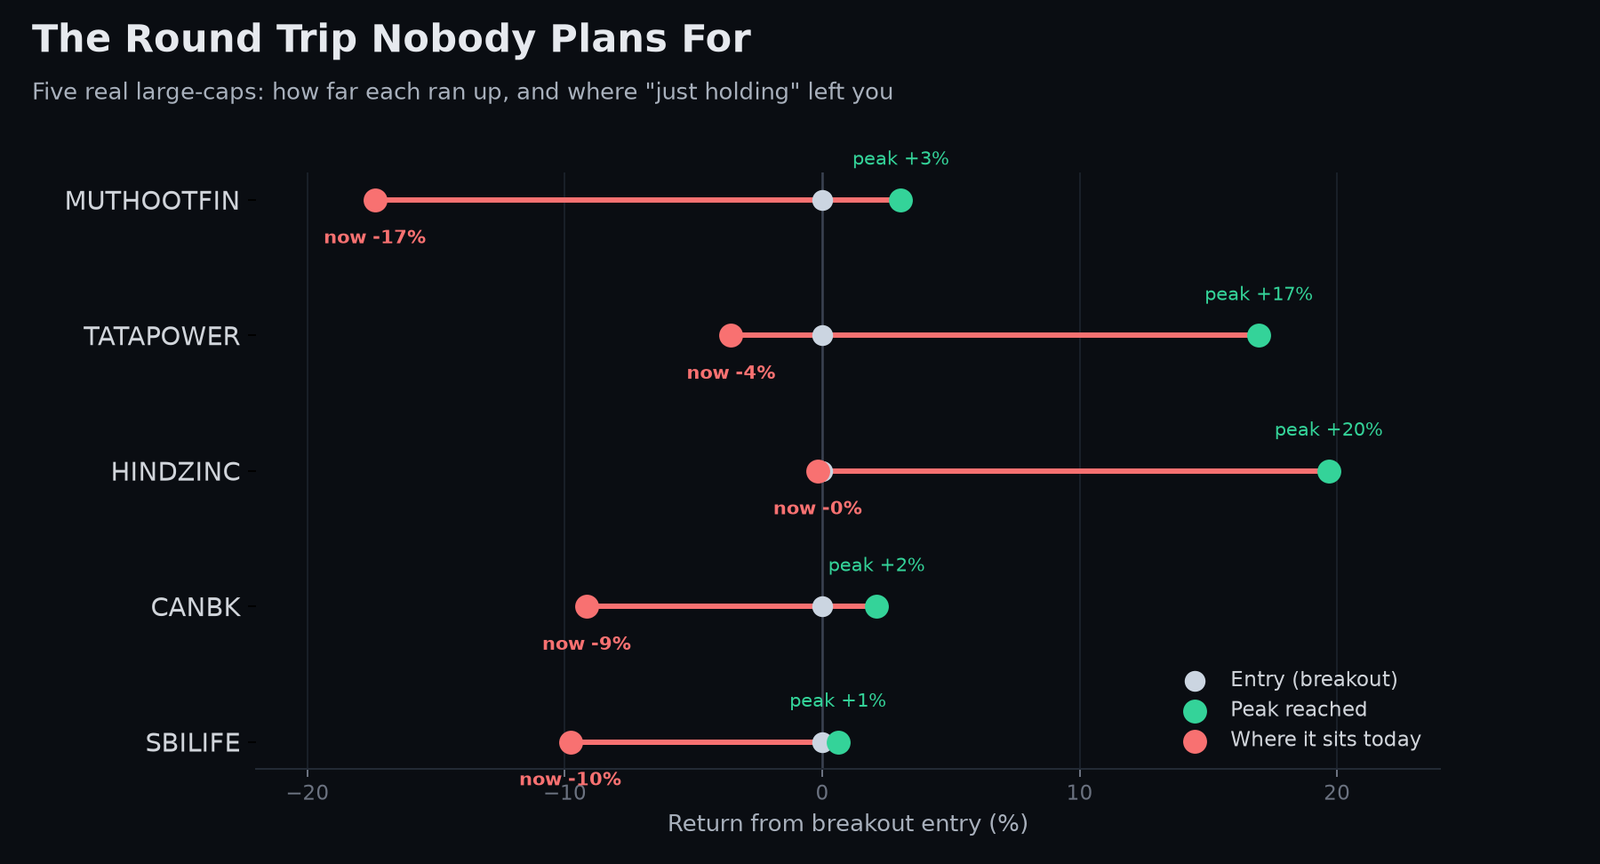 Grey = entry, green = peak reached, red = where it sits today — the gap is what "just holding" cost.
What happens when nobody has an exit plan — real, recent, large-cap names:
| Stock | Broke Out At | Peak Price | Current Price | Drawdown From Peak |
|---|---|---|---|---|
| MUTHOOTFIN | ₹3,503 | ₹3,610 | ₹2,894 | -19.8% |
| TATAPOWER | ₹395 | ₹462 | ₹381 | -17.5% |
| HINDZINC | ₹559 | ₹669 | ₹558 | -16.6% |
| CANBK | ₹142 | ₹145 | ₹129 | -11.1% |
| SBILIFE | ₹1,971 | ₹1,983 | ₹1,778 | -10.3% |
These are not obscure names — Muthoot Finance, Tata Power, Hindustan Zinc, Canara Bank, SBI Life. All five had genuine Stage 2 breakouts earlier this year, all five ran up nicely, and all five have since rolled over into Stage 3 or Stage 4 (confirmed downtrend) — quietly giving back 10-20% of value from their peak while a "buy and forget" investor kept holding, waiting for a bounce that the Stage classification was already telling them not to expect.
Now here's the part that actually matters — what the exit signal was worth, in rupees:
For SBILIFE and HINDZINC, the exact date each one flipped into Stage 3 ("Topping") is on record. If you'd sold the moment that flag triggered, instead of holding through to today:
| Stock | Value if exited at Stage 3 trigger | Value if still holding today | What staying invested cost you |
|---|---|---|---|
| SBILIFE | ₹1,00,000 | ₹92,846 | -₹7,154 (7.7% worse) |
| HINDZINC | ₹1,00,000 | ₹93,475 | -₹6,525 (7.0% worse) |
That's real money, on real large-cap names, lost purely to not having an exit rule — not because the original entry was wrong. The RS and Stage signal that got you in early is the exact same signal that tells you when the story is over. Ignoring the second half of that signal is how a good trade quietly turns into a mediocre one, or a mediocre one turns into a real loss. The ALKALI example earlier in this piece showed the same discipline on the downside protection — a small, defined -0.67R loss instead of an open-ended one — precisely because the exit was decided on the way in, not improvised on the way out.
The takeaway: treat the exit signal with the same seriousness as the entry signal. A Stage 2 breakout with strong RS is your buy cue. A flip to Stage 3 — especially with distribution risk (rising volume, falling delivery %) — is not "just a pullback, it'll come back." It's the same system, the same discipline, just running in reverse.
"Okay, but why not just do a SIP?"
Fair question, and it deserves an honest answer, not a sales pitch.
A SIP (Systematic Investment Plan) — putting a fixed amount into an index fund or mutual fund every month, no matter what the market is doing — is genuinely one of the best wealth-building tools that exists for most people. It requires no skill, no screen time, no emotional discipline beyond "don't stop." Over 15–20 years, that quiet, boring consistency beats almost everything retail investors try to do actively. If you take one piece of advice from this entire article, let it be: don't stop your SIP because of anything written here.
But a SIP and Relative Strength investing aren't actually solving the same problem, and it's worth being precise about that instead of pretending one replaces the other:
- A SIP buys the average. You're intentionally buying the whole market — the winners and the laggards together — because over long enough time, the market's average return is genuinely good, and you don't have to know which stocks will be the winners.
- Relative Strength is for the part of your money that wants to try to do better than average, by identifying which individual stocks are already winning the race against that same average — before the crowd notices.
A SIP is patient and passive by design. Relative Strength is active and requires you to actually look, actually check the screener, actually act on what it shows you. It carries real risk that a diversified index fund doesn't — a single stock can go quiet and stay quiet, or the strength can fade before it ever becomes a visible move. This is not a "safer" strategy than a SIP. It's a different tool for a different job: a SIP builds your foundation; Relative Strength is for someone who wants an edge on the active portion of their money and is willing to do the work of checking it.
Here's the part that's genuinely worth sitting with, though: nobody teaches you any of this. Not in school, not in most colleges — you can finish an entire engineering or commerce degree in this country without ever being taught what relative strength is, what a Stage 2 breakout looks like, or why a stop-loss should be decided before the trade, not during it. The gap between the SIP-only investor and the one beating the index isn't intelligence or luck. It's just awareness — spending a small, consistent amount of time actually paying attention to what the market is telling you, instead of assuming it's too complicated to bother with. The tables in this article aren't the result of genius. They're the result of a system that pays attention every single day so you don't have to teach yourself from zero — and that little bit of awareness, applied consistently, is what turns "the market's average return" into something meaningfully better.
Anyone telling you an individual-stock strategy is a strict upgrade over a SIP is selling you something. The honest version is: they solve different problems, and the smartest retail investors usually run both — a boring, automatic SIP as the base, and something like Relative Strength for the money they're actively trying to make work harder.
The actual takeaway
You don't buy the top because you're bad at investing. You buy the top because you're using a signal — price — that is mathematically guaranteed to be the last one to move. Smart money isn't smarter. It's just further upstream, watching strength instead of watching noise.
Relative Strength doesn't promise to make you rich. It promises something much more useful: to move you a few weeks earlier in the story than you've been standing your whole investing life — and just as importantly, to tell you when to leave before the story turns on you.
Three questions, one honest problem
Step back and look at what actually stops most retail investors from making money in the market. It's never really "which stock." It's three specific, unglamorous questions that nobody teaches you to answer:
What do I invest in? Not a stock a friend mentioned, not a trending name on an app — something that's already quietly proving itself against the market, before the crowd shows up.
Where do I get in? Not "somewhere around here looks cheap" — an actual level, a defined entry, a defined risk, decided before you click buy, not felt out in the moment.
When do I get out? Not "I'll know it when I see it" — the question every retail investor answers wrong, over and over, because nobody built them a rule for it. This article showed you exactly what that costs, in rupees, on names as familiar as SBI Life and Hindustan Zinc.
Every table in this article — the 35-stock sector breakdown, the ₹35 lakh portfolio, the exit-discipline numbers — comes from the same discipline applied consistently across seven sectors and three company sizes. Not a tip. Not a forecast. A number that gets checked daily, a stage that tells you where a stock actually stands in its own cycle, and a plan for the entry, the stop, and the exit written down before a rupee is at risk.
So here's the actual choice in front of you, and it's a smaller one than it looks: you can keep doing what most retail investors do — wait for a stock to become exciting, buy it there, and hope you'll somehow know when to sell. Or you can start asking the three questions this piece walked through, on whatever you're already watching, before the crowd gets there.
I'll be writing the Wyckoff/Dow Theory piece this article kept teasing sometime soon — if that's the kind of rabbit hole you enjoy falling into, it'll be here when it's ready. And if you're reading this thinking "the idea makes sense, but I wouldn't know where to start building my own RS/Stage tracking" — that's a completely normal place to be, and not one you have to figure out alone. I happen to know of a resource that bundles RS, Stage, VCP, VSA, CPR, and pivot screening all in one place for less than the price of a couple of coffees a month — genuinely well put together, not a gimmick. Drop me a note, tell me where you're stuck, and I'm happy to point you in the right direction.
Related: why algo trading is a systems problem, not a psychology problem, and what actually happened to ₹30 lakh invested since 2016 — if you want the longer-horizon, SIP-adjacent side of this same conversation.
Disclaimer: This article is for educational purposes only and does not constitute investment advice, a recommendation, or a solicitation to buy or sell any security. All stock examples, returns, and portfolio figures shown are based on real historical data, but past performance is not indicative of future results — every example here was selected after the fact to illustrate how the Relative Strength and Stage methodology works, not as a live, forward-looking recommendation, and hindsight-selected examples will always look cleaner than trading in real time. Equity markets carry real risk of loss, including the possibility of losing your entire principal. Please consult a SEBI-registered investment advisor and do your own research before making any investment decision. Nothing on this site constitutes personalized investment advice.
— Shak