
Wednesday, August 5, 2026 — A Gap-Up Open Fades Hard, Then Recovers Into a Positive Close
Market Overview
Wednesday opened with a real gap — 24,715.00, well above Tuesday's 24,552.30 close — and pushed further in the first minutes to a session high of 24,740.00, a fresh weekly high. For a moment, it looked like the market was shrugging off Tuesday's reversal entirely.
It didn't hold. A sustained selling stretch through the morning dragged price steadily lower, eventually testing 24,565.00 — landing almost exactly on July's old high, a level that had sat untouched as resistance for weeks. That test held. From there, a genuine afternoon recovery took over, carrying price back up through the session's middle references and into a close at 24,647.70, up 92.10 points (+0.38%) — comfortably positive, though well off the day's 24,740.00 high.
This was a three-act session: a gap-up open that couldn't hold its own high, a morning fade that found real support at a meaningful old level, and an afternoon recovery strong enough to turn the day positive despite losing nearly 175 points from peak to trough along the way.
Order Flow Analysis
The gap-up open
The first bars carried a genuinely mixed but net-positive tape (-196, +568, -108, +438, -54, +288, +533) — a two-sided open, but one that leaned enough to push price to the session high of 24,740.00. This wasn't the kind of overwhelming one-directional buying that confirms a gap is being extended; it was closer to residual momentum from the open itself.
The morning sell-off
That's exactly where the character of the session flipped. A run of negative prints — -455, -138, -194, -337 — marked the first real selling of the day, right as price backed off the highs near the prior session's pHigh reference at 24,697.0. After a brief pause (+43, -78), the heaviest single print of the entire session hit: -748, a genuinely large sell order that did more damage to the session's structure than anything that preceded it. Two more negative prints (-322, -275, -155) followed, and together this stretch is what took price all the way down to the 24,565.00 low — landing squarely on July's old high.
The turn at the old high
Once price reached that level, the tape stabilized. A sequence of small, mixed prints (+46, +51, +25, -190, -74) showed neither side pressing hard — the market digesting the fact that a meaningful old reference had just been tested and held.
The afternoon recovery
Then the tape turned decisively positive. +237, followed by the second-largest print of the day in either direction — +1.09K — and then another strong bar, +744, drove price back up through the middle of the day's range. A small -196 into the very close did nothing to dent the recovery. This closing sequence, +237, +1.09K, +744, is what turned a session that had lost nearly 175 points from its high into a comfortably positive close.
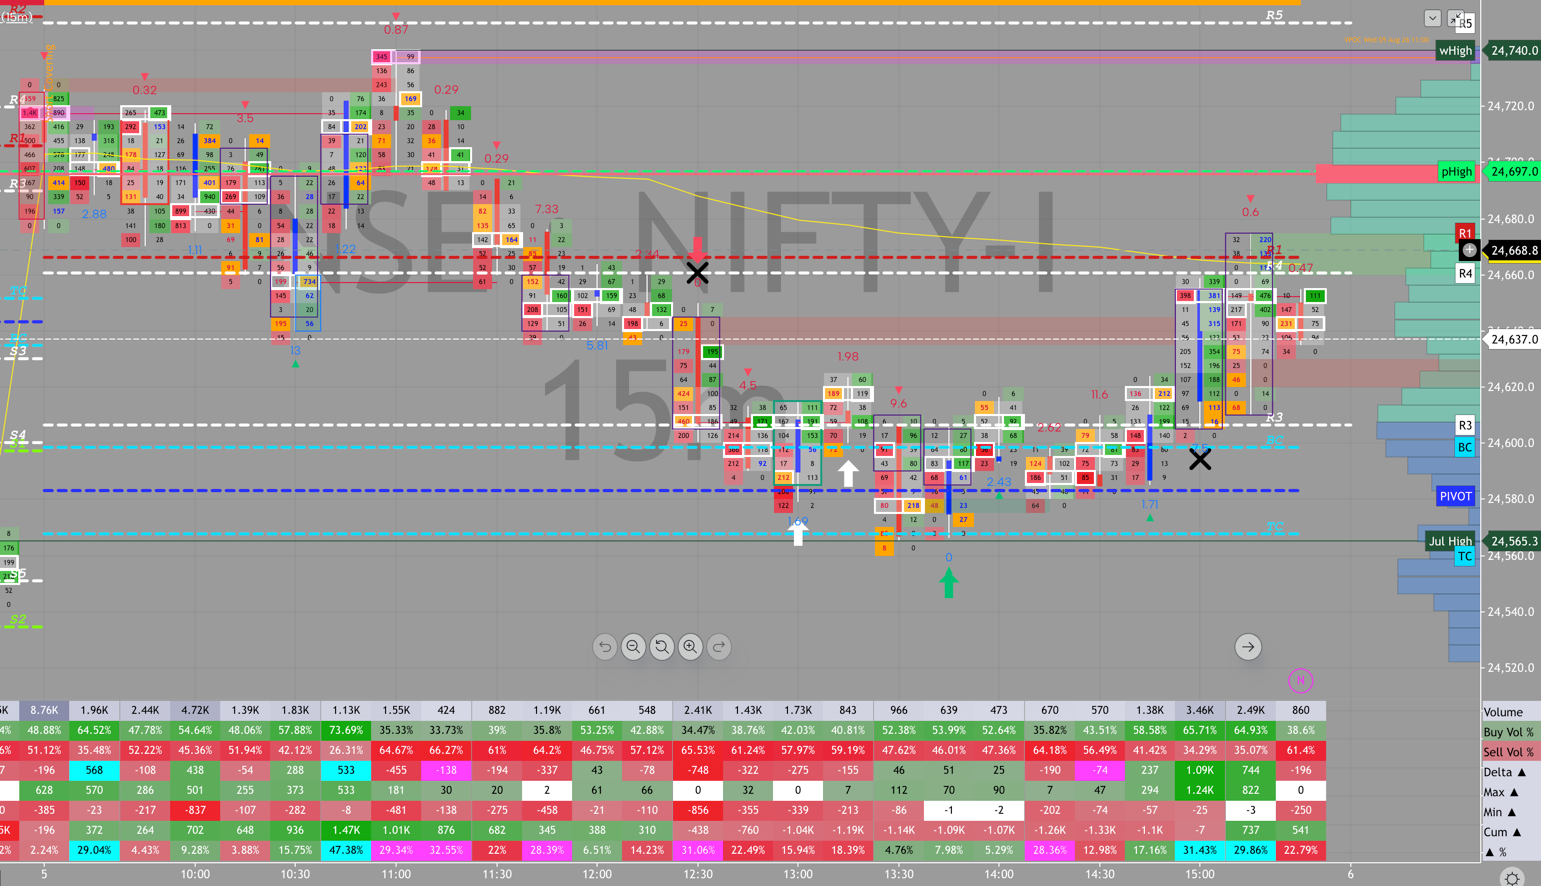 Order flow footprint, NIFTY 15m — August 5, 2026.
Key Order Flow Takeaway
- A mixed but net-positive open (-196, +568, -108, +438, -54, +288, +533) pushed price to a fresh weekly high of 24,740.00 on residual momentum rather than overwhelming conviction.
- A heavy -748 print — the single largest of the session — anchored a broader selling stretch (-455, -138, -194, -337, -322, -275, -155) that dragged price down nearly 175 points from the high.
- The sell-off found real support exactly at 24,565.00, essentially on top of July's old high — an old resistance level doing new work as support.
- A strong closing sequence (+237, +1.09K, +744) reversed the entire morning's damage and then some, turning the session solidly positive by the close.
Market Profile Analysis
Wednesday's developing profile shows the session clearly in two pieces: an upper cluster forming near the day's highs, with a developing Poor High around 24,678.4 and a secondary reference near 24,640, sitting above a distinct lower zone around 24,588.8 — that lower reference is essentially the profile's own record of the morning's sell-off finding a floor. The white POC line at 24,637.0 sits almost exactly at today's close, which is a genuinely healthy sign: the session's fair-value price and its actual closing price converged, rather than closing at an extreme.
Zooming out, today's range sits cleanly above every prior reference on the chart — Friday's high (24,486.4), Thursday's (24,364.6 area) — all untouched beneath the current structure. The one level that mattered today wasn't from this profile at all: it was July's old high at 24,565.3, which the morning sell-off tested almost to the tick before buyers stepped back in.
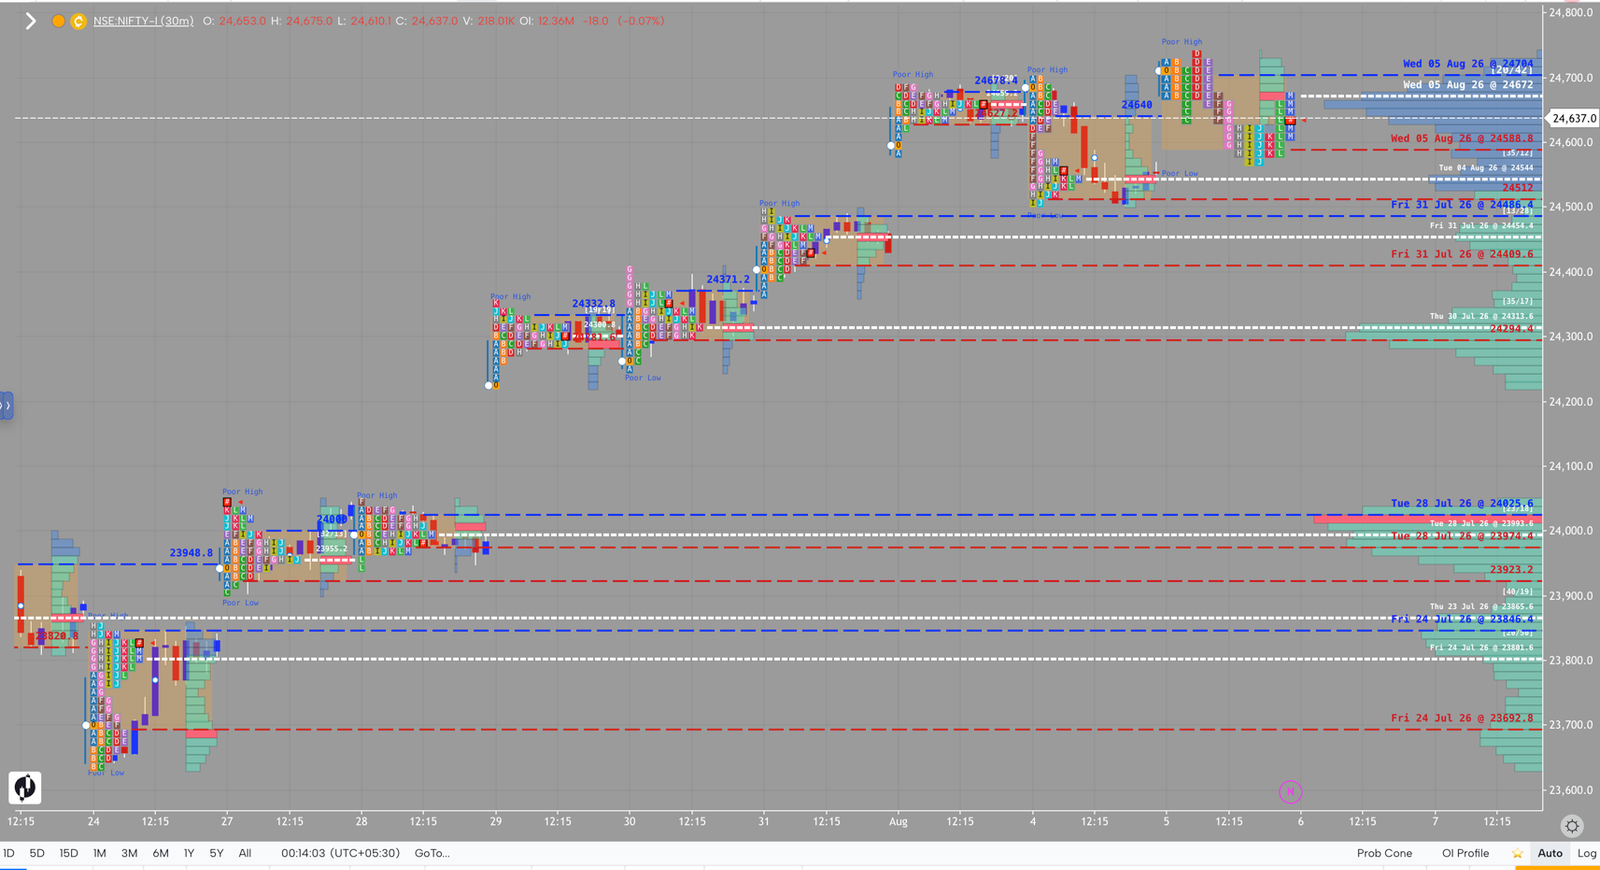 Market Profile (TPO), NIFTY 30m — August 5, 2026, developing session.
Structural Levels
- 24,740.00 — today's high, the freshest weekly-high reference; a level that needs reclaiming to suggest today's early strength wasn't a one-session event.
- 24,715.00 — today's open; price traded both well above and well below this level intraday, making it a reasonable pivot reference for Thursday.
- 24,678.4 — today's developing Poor High, unconfirmed.
- 24,647.70 — today's close, converging closely with the session's own point of control at 24,637.0 — a healthy sign of acceptance rather than an extreme close.
- 24,588.8 — today's developing Poor Low, marking where the morning's selling ran out of room.
- 24,565.00 / 24,565.3 — today's session low, landing almost exactly on July's old high; the most structurally significant level of the day, now flipped from resistance to tested support.
Trading Implications
Recovery-confirmed scenario: A Thursday session that holds above 24,588.8 and clears 24,740.00 with genuine buy-side delta would confirm the afternoon recovery has real legs, opening a path toward fresh highs beyond this week's range.
Consolidation scenario: A session that stays contained between 24,565.00 and 24,740.00 would suggest the market wants to digest both the morning's sell-off and the afternoon's recovery before committing to a direction — a reasonable pause after a genuinely volatile session.
Retest scenario: A close back below 24,565.00 would mean July's old high has failed as support on a retest, reopening the path toward Tuesday's low at 24,500.00 and below.
Conclusion
Wednesday packed a full week's worth of structure into a single session — a gap-up that couldn't hold, a sell-off heavy enough to erase most of the gap, a textbook test of an old resistance level turned support, and a closing recovery strong enough to finish comfortably positive anyway. The -748 print did the real technical damage; the +1.09K print that followed a few hours later did just as much to undo it. Thursday's job is straightforward: show whether 24,565.00 holding was a genuine floor or just a pause on the way to testing it again.
Related: this session reverses Tuesday's sharp fade — together the two sessions show the market testing both its recent high and an old structural level within 48 hours of each other.
— Shak