
Friday, October 23, 2026 — Gap-Up Above the Poor High, 418-Point Sell-off to the Weekly Low, and Close at 22,589
NIFTY futures opened Friday at 22,780.0 — a 57-point gap above Thursday's 22,723 close — and immediately pushed to 22,853.3, clearing Thursday's pHigh at 22,818.6 and the Poor High at 22,748.4. It looked like the recovery had legs. It did not. Short Buildup from the opening bar turned the session into a 418-point waterfall: pHigh to TC to BC to September low to S1 to the weekly low at 22,435.0. The close was 22,589.0, down 122.3 points (-0.54%). Thursday called the September low a stop-hunt. Friday answered by taking it again.
The pre-market note said below 22,748 the tail was open. The open was above 22,748. It lasted less than one period.
Order Flow Analysis
The gap-up that was never real
The session opened at 22,780 and the first bars were heavy — 6.75K, 4.2K, 3.88K volume in the opening 15-minute bars. But the cumulative delta turned negative by bar two and never recovered through the morning. OI Sense told the story from the start: Short Buildup — new positions being added on the sell side, not covering by existing shorts. A push higher on new short supply is not a rally; it's a trap. The high at 22,853.3 printed a Poor High — a thin bracket of TPOs before the reversal began, price accepted there for barely one period.
VWAP rolls over and every level falls in order
VWAP started the session near 22,820 and curved steeply downward from the first bar. From the high, cumulative delta slid as price walked through the structure: Thursday's pHigh (22,818.6), TC, BC, S3, the September low at 22,584.9 — breached for the second consecutive session — and then S1 and S4 in the 22,550 zone. The selling continued all the way to 22,435.0, the session's low, which matches the weekly low (wLow) on the chart. The session's heaviest volume bar, at 8.88K contracts, printed near this extreme — a climactic print, the kind that marks the end of a one-directional move rather than continuation.
Recovery from the weekly low
From 22,435, a recovery began. The final hour of the session showed steady moderate volume — 3.44K, 2.66K, 2.51K, 2.67K, 3.65K per bar — without the panic of the sell-off. The close came in at 22,589.0, just above the September low (22,584.9), within the session's value area. Short Covering drove the lift — the same pattern as Thursday, where whoever shorted the break bought it back into the close. The difference is that Thursday closed 20 points down after a 268-point range. Friday closed 122 points down after a 418-point range. The recovery was real but partial.
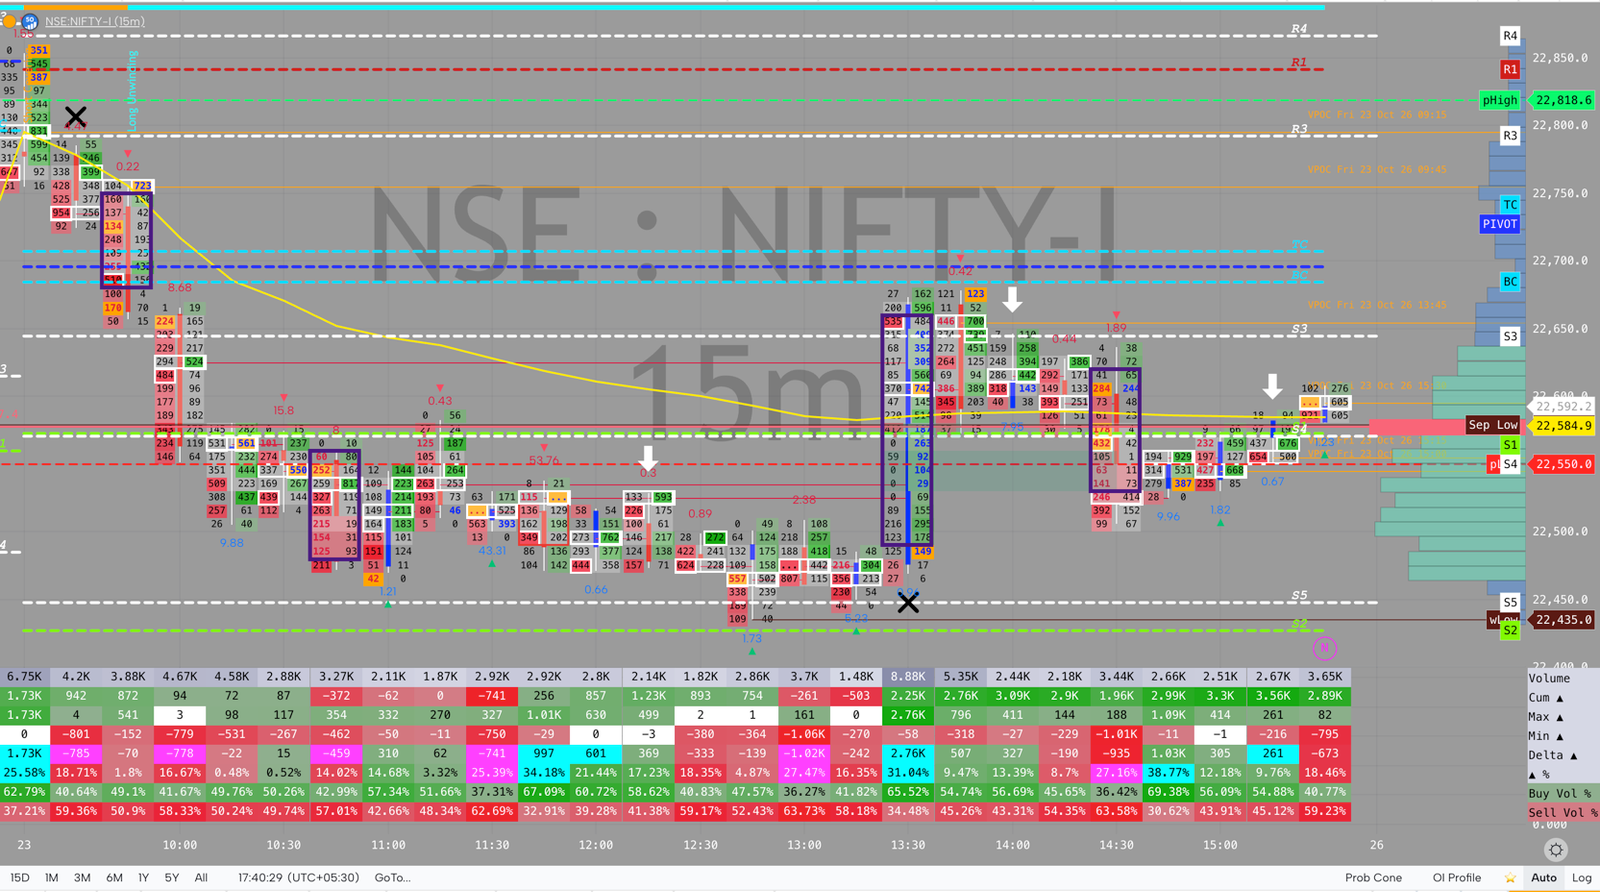
15-minute footprint. Opening push to 22,853 on Short Buildup, VWAP curving steeply down from the open, sell-off through pHigh, TC, BC, September low, S1, and the weekly low at 22,435.0. Heavy 8.88K bar at the low. Short Covering-led close at 22,589.
Key Order Flow Takeaway
- The open gapped above Thursday's Poor High — 22,780 to 22,853 in the first period, then immediate reversal. A classic squeeze above a key level followed by exhaustion.
- OI Sense read Short Buildup from the open — the push to 22,853 was new short supply entering, not buyers pressing the breakout.
- Cumulative delta went negative by bar two and stayed negative through the entire descent. The 8.88K volume bar at the wLow (22,435) is the session's signature print — peak volume at the extreme.
- September low breached for the second consecutive session — 22,435 is now 149 points below the September low (22,584.9), and the close at 22,589 is barely above it.
- The recovery was Short Covering, not fresh buying conviction. Close at 22,589 is within value, but 191 points below the open.
Market Profile Analysis
Today builds a b-shape — a poor high from the opening spike, value formed in the lower half of the range, and a poor low at the session's extreme. The Poor High at 22,853 is the profile's defining label on the upside: barely one period of TPOs at the top before the market left and never returned. The value area runs from roughly 22,467.6 to 22,657.2, with the heaviest concentration around 22,574.3, which is also close to where the session closed (22,589). The profile says the market found acceptance in the lower third of Friday's range, not near the top.
The Poor Low at 22,435 is the flip side of the poor high — another thin auction at an extreme, this time on the downside. Single prints in the 22,435 to 22,467 zone are the tail. They represent a failed attempt to auction lower: sellers pushed to 22,435, found no acceptance, and the market reversed. Single-print tails invite revisits — price tends to return and try to fill them — but the close above the September low (22,584.9) and within the value area argues that Friday's auction ended with the market rejecting both extremes.
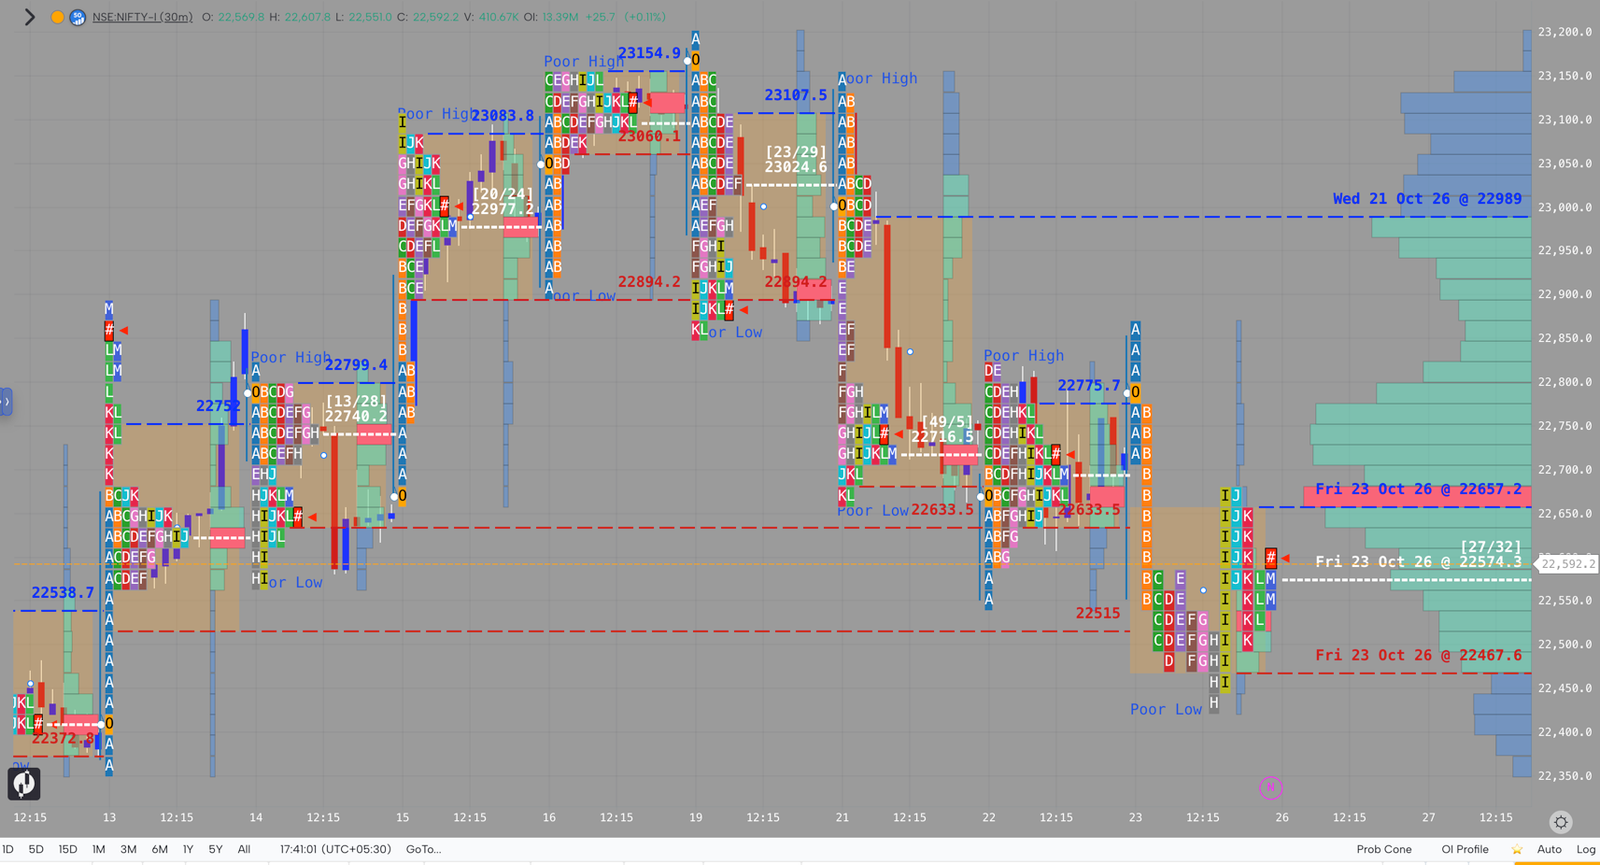
30-minute TPO. A b-shape profile: Poor High at 22,853 from the opening spike, value area 22,467.6 to 22,657.2, POC at 22,574.3, and a Poor Low tail at 22,435.0. Wednesday's reference at 22,989 shows how far the week's range has fallen from Monday's levels.
Structural Levels
For next week, from Friday's H/L/C (22,853.3 / 22,435.0 / 22,589.0): an extremely wide CPR reflecting the 418-point range — the widest session of the month. Bearish lean. The close is in the lower third of the week's range, and the weekly low was tagged and recovered, not broken and held.
Resistance
- 22,620 — Thursday's S3, Friday's overhead. The first meaningful level above the close.
- 22,657.2 — Friday's upper value area boundary. A close above here opens Thursday's profile.
- 22,748.4 — Thursday's Poor High. The ceiling that held through most of Friday.
- 22,818.6 — pHigh. Above the Poor High, the next reference.
- 22,853.3 — Friday's high. Failed auction from the open.
- 22,989 — Wednesday's (Oct 21) session reference, visible in the composite profile. Now 400 points above the close.
Support
- 22,584.9 / 22,574.3 — September low and Friday's POC. The close sits just above this band. Losing it reopens the tail.
- 22,550 — S1/S4. Gave way Friday; now flips to resistance on a failed retest.
- 22,467.6 — Friday's lower value area. Below this, the single-print tail begins.
- 22,435.0 — Friday's low / weekly low. A break here on Monday has no structural support visible until the 22,372 area from earlier in the month.
Options and Futures OI
Futures OI closed up +0.11% on a down session — a textbook Short Buildup read. New short positions were being added through the sell-off, not just long liquidation as on Thursday. This is a structurally different signal: Thursday's Long Unwinding said existing longs were exiting. Friday's Short Buildup says fresh shorts entered. The distinction matters for Monday: long liquidation tends to exhaust itself once the longs are out; short buildup creates a pool of positions that need to be covered, which becomes the fuel for any recovery rally.
The September low has now been breached on two consecutive sessions and recovered both times. The close above 22,584.9 on Friday keeps the interpretation ambiguous — this could still be a two-day stop-hunt below a significant monthly level, or it could be the early innings of a genuine structural breakdown. The monthly expiry on Tuesday Oct 27 will force a resolution: either the shorts cover into expiry (recovery) or they don't (continuation lower). The 22,435 weekly low is the line that separates a squeeze from a trend.
Trading Implications
The bear continuation case. Short Buildup across the entire session, September low breached twice in two days, weekly low tagged, close in the lower third of the week's range. Two consecutive sessions of failed auctions at the highs and recoveries that leave the close well below the open. The b-shape profile with a poor high says sellers are aggressive at every strength. Monday's open below 22,584.9 (September low) confirms continuation.
The squeeze case. Weekly low tagged and recovered, close within value, Short Covering into the close, Poor Low at 22,435 means that auction failed. The buildup of short positions visible in the OI data is also the fuel for a reversal: a recovery through 22,657.2 (upper value area) with Short Covering would set up a test of Thursday's Poor High at 22,748. Expiry-week positioning often forces exactly this kind of stop-hunt in both directions.
The level that decides it. 22,584.9 on the downside (September low — a third breach that doesn't recover signals the next leg), 22,657.2 on the upside (Friday's upper value area — a Monday open or early close above here and the b-shape's message changes entirely).
For how these order-flow, OI and market-profile reads fit together with CPR and pivots, see Reading the Market. The month-in-review for every completed month is the Monthly Framework Ledger; every prior session is in the Daily Recap archive. The running, day-by-day record of these calls is the Framework Scorecard.
This recap is the derivatives side — intraday and short swings. For the investing companion, see The Relative Strength Line Nobody Taught You to Read and Catch Wealth Before It Runs.
Conclusion
Friday opened above Thursday's key levels, fooled exactly no one for exactly one period, and then sold 418 points. The weekly low at 22,435 was tagged, rejected, and recovered. Two consecutive sessions of September-low breaches, two consecutive recoveries. The market is telling you it knows where the stops are. What it hasn't told you yet is whether it's going back for more or finished with the floor work. Monday's open will have a clear opinion.
Related: Thursday, October 22, 2026 — Gap Down Below pLow, September Low Breached at 22,550, and a Flat Close.
Not investment advice. This is a study of order flow, market profile, and open interest for educational purposes. Trade your own plan.
— Shak